
TradingView is one of the most widely used charting platforms in trading, but its sheer number of tools can feel overwhelming the first time you open it.
What is TradingView?
TradingView is a web-based financial charting and analysis platform that covers stocks, forex, crypto, commodities, indices, bonds, and ETFs. It works as an interface for analysis and order routing, meaning it doesn’t process trades itself. When you connect a broker, your credentials stay with that broker, and TradingView simply sends your orders there for execution.
The platform supports connections to multiple licensed brokers and crypto exchanges directly from its charting interface, called Supercharts. You can access it through a web browser, a downloadable desktop app (available for Windows, macOS, and Linux), or a mobile app on Android and iOS.
What sets TradingView apart is the combination of professional-grade tools and a massive user community. The platform offers over 100 pre-built technical indicators, 21 chart types, and more than 90 drawing tools. On top of that, the community has published more than 100,000 custom indicators that anyone can apply. As of 2025, more than 50 million traders and investors use TradingView worldwide.
A free tier is available with restrictions on the number of indicators per chart, active alerts, and access to features like auto chart pattern recognition. Paid plans lift those limits, and the jump between tiers matters once you start tracking multiple assets or layering several indicators on a single chart.
How to create a TradingView account
- Go to tradingview.com and click the sign-up button. You can register using an email address or sign in through Google, Facebook, X, Yahoo, Apple, or LinkedIn.
- Confirm your email. TradingView sends a registration email. Click the confirmation link to activate your account.
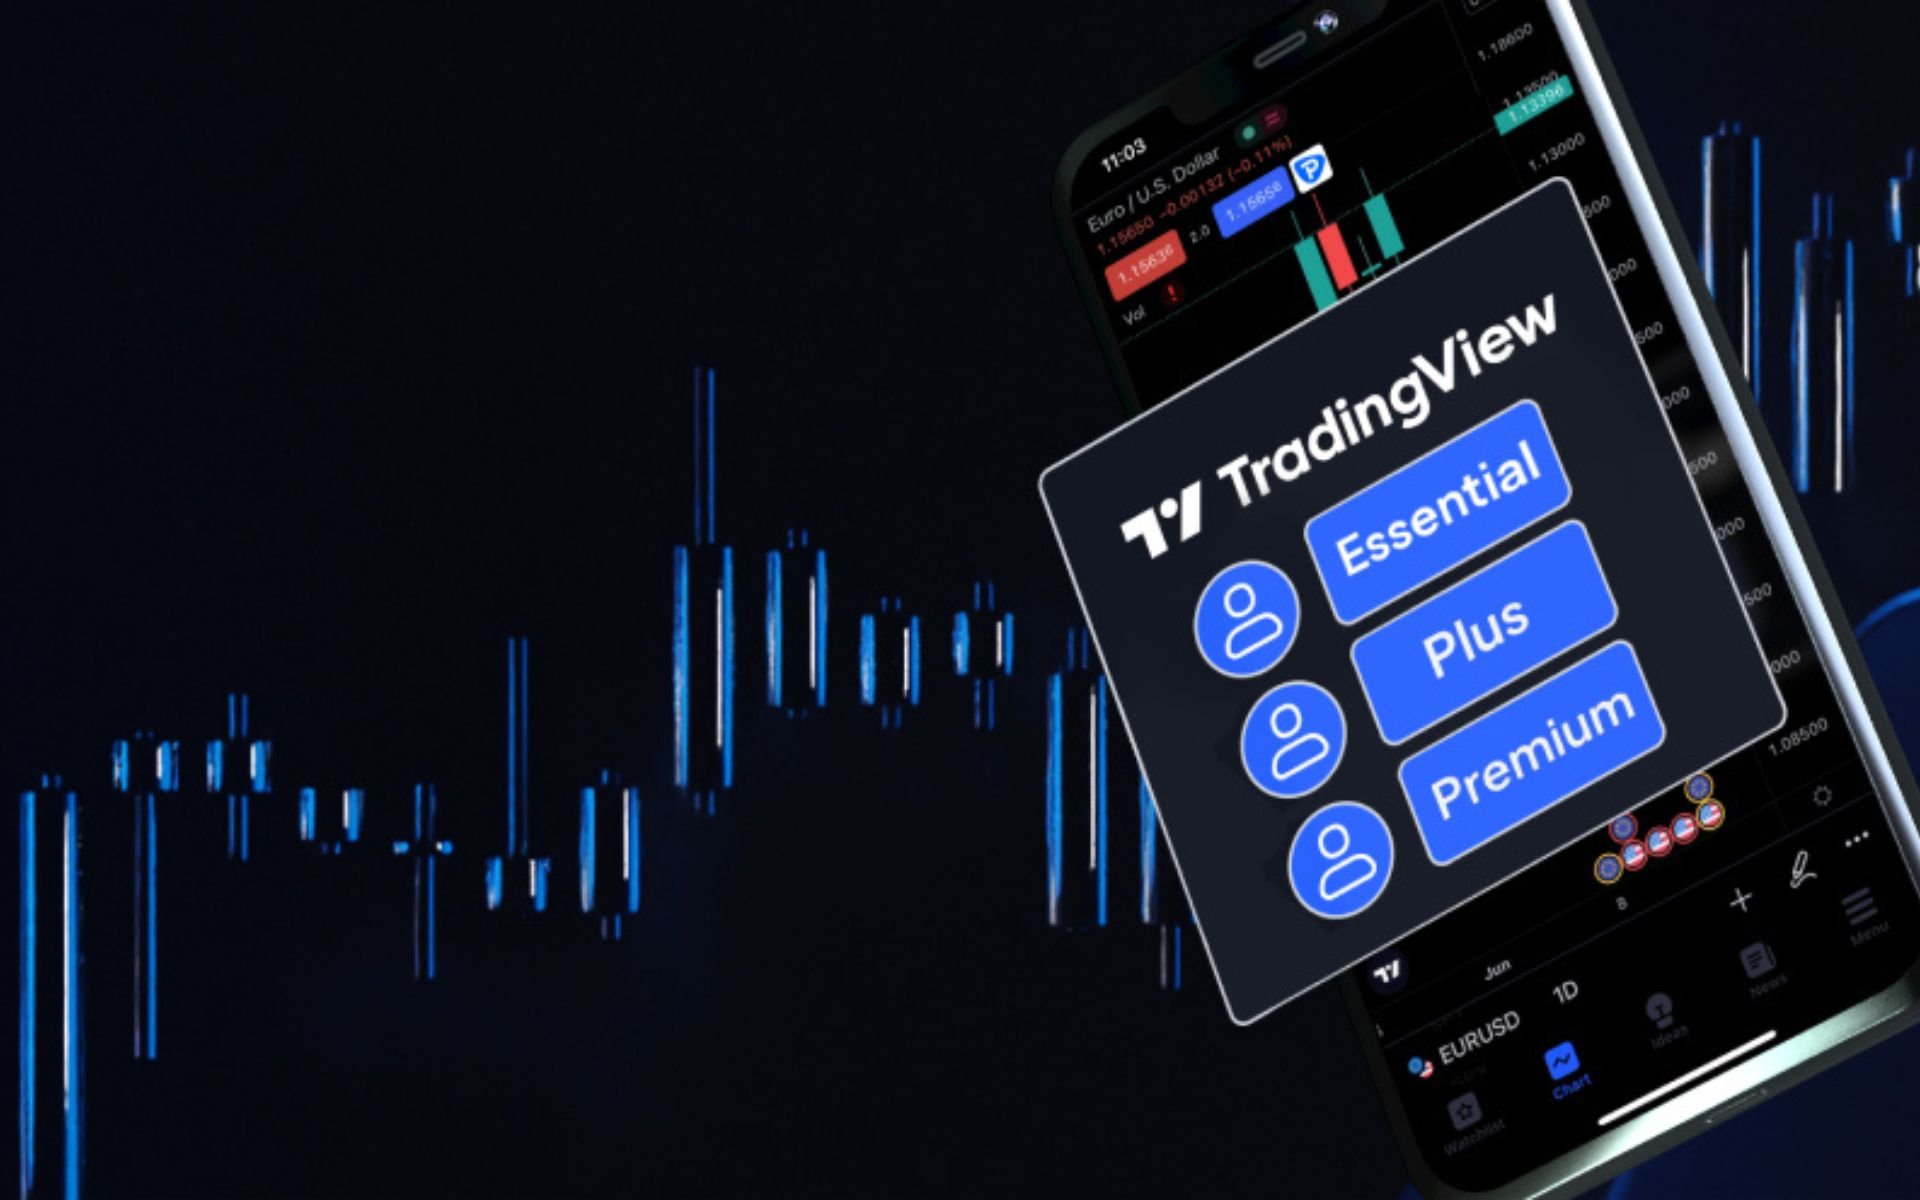
- Choose a plan. You’ll start on the free plan by default, which is a good fit for beginners who are still learning the interface. If you already know you’ll be tracking multiple assets or need more than a handful of indicators on one chart, you can upgrade to a paid plan (Essential, Plus, Premium, or higher tiers) at any time.
- Start exploring. Once your account is active, you have immediate access to charting, watchlists, community content, and paper trading. There’s no waiting period or approval process.
The free plan gives you enough room to learn the platform and practice with paper trades. Active traders who run setups across several markets will hit the indicator and alert limits fairly quickly, though, so upgrading is worth considering once your workflow demands it.
Navigating the TradingView dashboard
The dashboard centers on the price chart, which takes up most of the screen and serves as your primary workspace. Everything else is arranged around it.
The top-left toolbar holds the tools you’ll use most often: symbol search, chart type selector, timeframe selector, indicator menu, alert button, and the replay tool for scrolling back through historical data.
The left sidebar contains all drawing tools. This is where you’ll find trendlines, Fibonacci tools, shapes, text annotations, measurement tools, wave and cycle tools, and graphic icons. Each category expands into subcategories when you click on it.
The top-right toolbar handles layout and settings. From here you can manage chart layouts, switch profiles, load chart templates, adjust settings, toggle full-screen mode, and take chart snapshots.
The right sidebar streams community posts, financial news, alert management, your watchlists, trading idea notes, and a chat feature. You can collapse or expand each panel depending on what you need visible.
At the bottom of the screen sits the Trading Panel. This is where you’ll see your connected broker account, open positions, order history, and account details. If you haven’t connected a broker yet, the panel still appears with the paper trading option.
Searching for symbols and building a watchlist
The symbol search field sits in the top-left toolbar. Type a ticker or asset name, and TradingView pulls up matching results across exchanges. If you’re on a paid plan, you can switch the data-providing exchange for a given symbol, which is useful when you want pricing from a specific source. That exchange-switching feature is uncommon on other platforms, one of several details worth checking against TradingView user reviews before you pay for a plan.
Once you find a symbol, adding it to a watchlist lets you track it without searching again each time. Watchlists keep your monitored assets organized in one place, and you can group symbols, reorder them, and create separate watchlists to match different workflows. A day trader might keep one list for high-volume stocks and another for crypto pairs, for example.
Setting up charts and choosing chart types
Click the candlestick icon in the top toolbar to switch between chart types. TradingView supports 21 total chart types, ranging from the basics to specialized formats used in specific trading styles.
The three standard types are candlestick, bar, and line. Candlestick charts are the most popular because each candle shows the open, high, low, and close for a given period, giving you a dense picture of price action at a glance. Line charts connect closing prices and work well for spotting the general direction of a trend without the noise.
Specialized types include Heikin Ashi, which smooths trends by averaging candle data to reduce visual clutter; Renko, which filters out small price movements entirely; Point and Figure, which ignores time and focuses on price changes of a set size; Kagi; and baseline charts.
The timeframe selector ranges from 1-second intervals all the way up to 12-month views. Day traders typically work with 5- or 15-minute candles, while swing traders lean toward 4-hour or daily timeframes. Picking the right timeframe matters because the same asset can look bullish on a 5-minute chart and bearish on a daily one.
In the chart settings panel, you can change candle colors, background color, timezone, gridlines, and scale type. Dark mode is available and worth turning on if you spend long sessions staring at charts. You can also display multiple charts side by side using layout options, and syncing lets all open charts scroll or change symbols together, so you don’t have to update each one individually.
Creating profiles and chart templates
A profile (called a chart layout in TradingView) saves a specific arrangement of charts, symbols, indicators, and drawing tools as one loadable workspace. You can rename a layout by clicking the layout name icon in the top-right toolbar and typing a new name.
This is especially useful when you trade across different markets or strategies. You might set up one layout for major crypto pairs with volume indicators and Fibonacci levels, and a separate layout for index futures with moving averages and VWAP. Switching between them takes a single click instead of rebuilding your setup from scratch.
Chart templates work differently. A template saves your indicator and style settings, not the symbol or drawings. Loading a template applies those settings to any chart instantly. If you always want RSI and Bollinger Bands with a specific color scheme, save that as a template and apply it to new charts whenever you need it.
TradingView remembers all applied indicators and tools when you save a layout, so nothing needs to be reapplied each session. Your work persists between logins.
Using drawing tools for technical analysis
The left sidebar holds TradingView’s full set of drawing tools, organized into categories. Each tool stays on your saved layout and can be revisited across sessions.
- Trendlines and channels. The basic trendline, ray, arrow, and parallel channel are used to map price direction and define the boundaries of a trend. A parallel channel is particularly useful for identifying a range-bound market where price bounces between two levels.
- Fibonacci tools. Retracement, extension, fan, arcs, and timezone tools help project pullback levels and potential price targets. Fibonacci retracement is the most common, used to identify where price might find support or resistance after a move.
- Pitchfork and Gann tools. These sit alongside Fibonacci in the retracement menu and serve traders who work with median-line analysis or Gann angles.
- Shapes. Rectangles, circles, triangles, and other shapes let you highlight zones on the chart, such as supply and demand areas, consolidation ranges, or gap fills.
- Text and annotation. Text boxes, callout labels, arrows, and flags let you add notes directly on chart areas. Useful for marking trade rationale or flagging levels to watch.
- Wave and cycle tools. Elliott Wave labels and cycle lines are built for traders who track wave-based price theories. The labels snap to candles, making it faster to mark wave counts.
- Measurement tools. Price range, bar count, and date range tools quantify moves on the chart. The price range tool is handy for quickly checking a move’s percentage or dollar value.
- Graphic icons. Visual markers for content creators who annotate charts before sharing them with followers or a community audience.
How to add and customize technical indicators
To browse available indicators, select the “Indicators” button from the top toolbar, which brings up a searchable library. TradingView’s built-in library includes widely used tools like RSI, MACD, Bollinger Bands, Moving Averages, VWAP, Stochastic Oscillator, On Balance Volume, and Keltner Channel.
Each of these indicators serves a different purpose. RSI (Relative Strength Index) measures overbought or oversold momentum, helping you spot when a move might be overextended. Bollinger Bands measure how far price deviates from a long-term average, so a squeeze in the bands often signals that a larger move is coming. VWAP (Volume Weighted Average Price) weights price by volume and is a go-to for intraday traders who want to see whether they’re buying above or below the day’s average traded price. On Balance Volume (OBV) tracks accumulation or distribution by comparing price direction with volume, which can confirm or contradict a trend.
Beyond the built-in options, the Community Scripts tab holds more than 100,000 user-created indicators. You can filter by Editors’ Picks, Top, or Trending to find well-tested scripts. Editors’ Picks in particular go through a vetting process, so they tend to be more reliable than random uploads.
To adjust any indicator after you’ve applied it, right-click it and select Settings. From there you can change the period length, color, and line style. If you want RSI calculated over 21 periods instead of the default 14, for example, this is where you’d make that change.
TradingView also lets you overlay a second symbol on the same chart to compare relative performance. Access this through the “+” icon near the symbol name. Plotting Bitcoin against Ethereum on the same chart, for instance, quickly shows whether one is outperforming the other over a given period.
Setting price alerts
You can set up an alert by selecting the alert icon in the top toolbar or by right-clicking any price level on the chart itself. Alerts trigger when price crosses a specified level, a trendline you’ve drawn, or an indicator threshold like RSI hitting 70.
Notifications can reach you as a pop-up on screen, an email, or a push notification on the mobile app. Because TradingView’s alerts are cloud-based, they fire even when you don’t have the platform open, which means you won’t miss a move just because you stepped away.
The free plan caps the number of active alerts you can run at once. Paid plans increase that cap significantly, which matters once you’re monitoring more than a handful of setups across different assets.
Using the screener to find trading opportunities
The screener is found under the Products tab on TradingView. Separate screeners exist for stocks, forex, and crypto, each pre-loaded with filters relevant to that market.
Filters let you rank instruments by price performance, oscillator signals, and trend strength. You could, for example, filter for stocks that are up more than 3% on the day with RSI below 70, or crypto pairs showing a bullish MACD crossover. The results update in real time, so you’re scanning live data rather than a stale snapshot.
The screener’s real value is narrowing down which symbols are worth charting in detail. Instead of scrolling through hundreds of tickers, you let the screener surface the ones that match your criteria, then pull them into your chart for deeper analysis. It’s a starting point, not a trade signal on its own.
Reading TradingView heatmaps
A heatmap displays the performance of an entire market in a single visual grid. Each block represents an individual asset, and the color tells you the direction: green blocks show positive price movement, red blocks show negative. The darker the shade, the stronger the move.
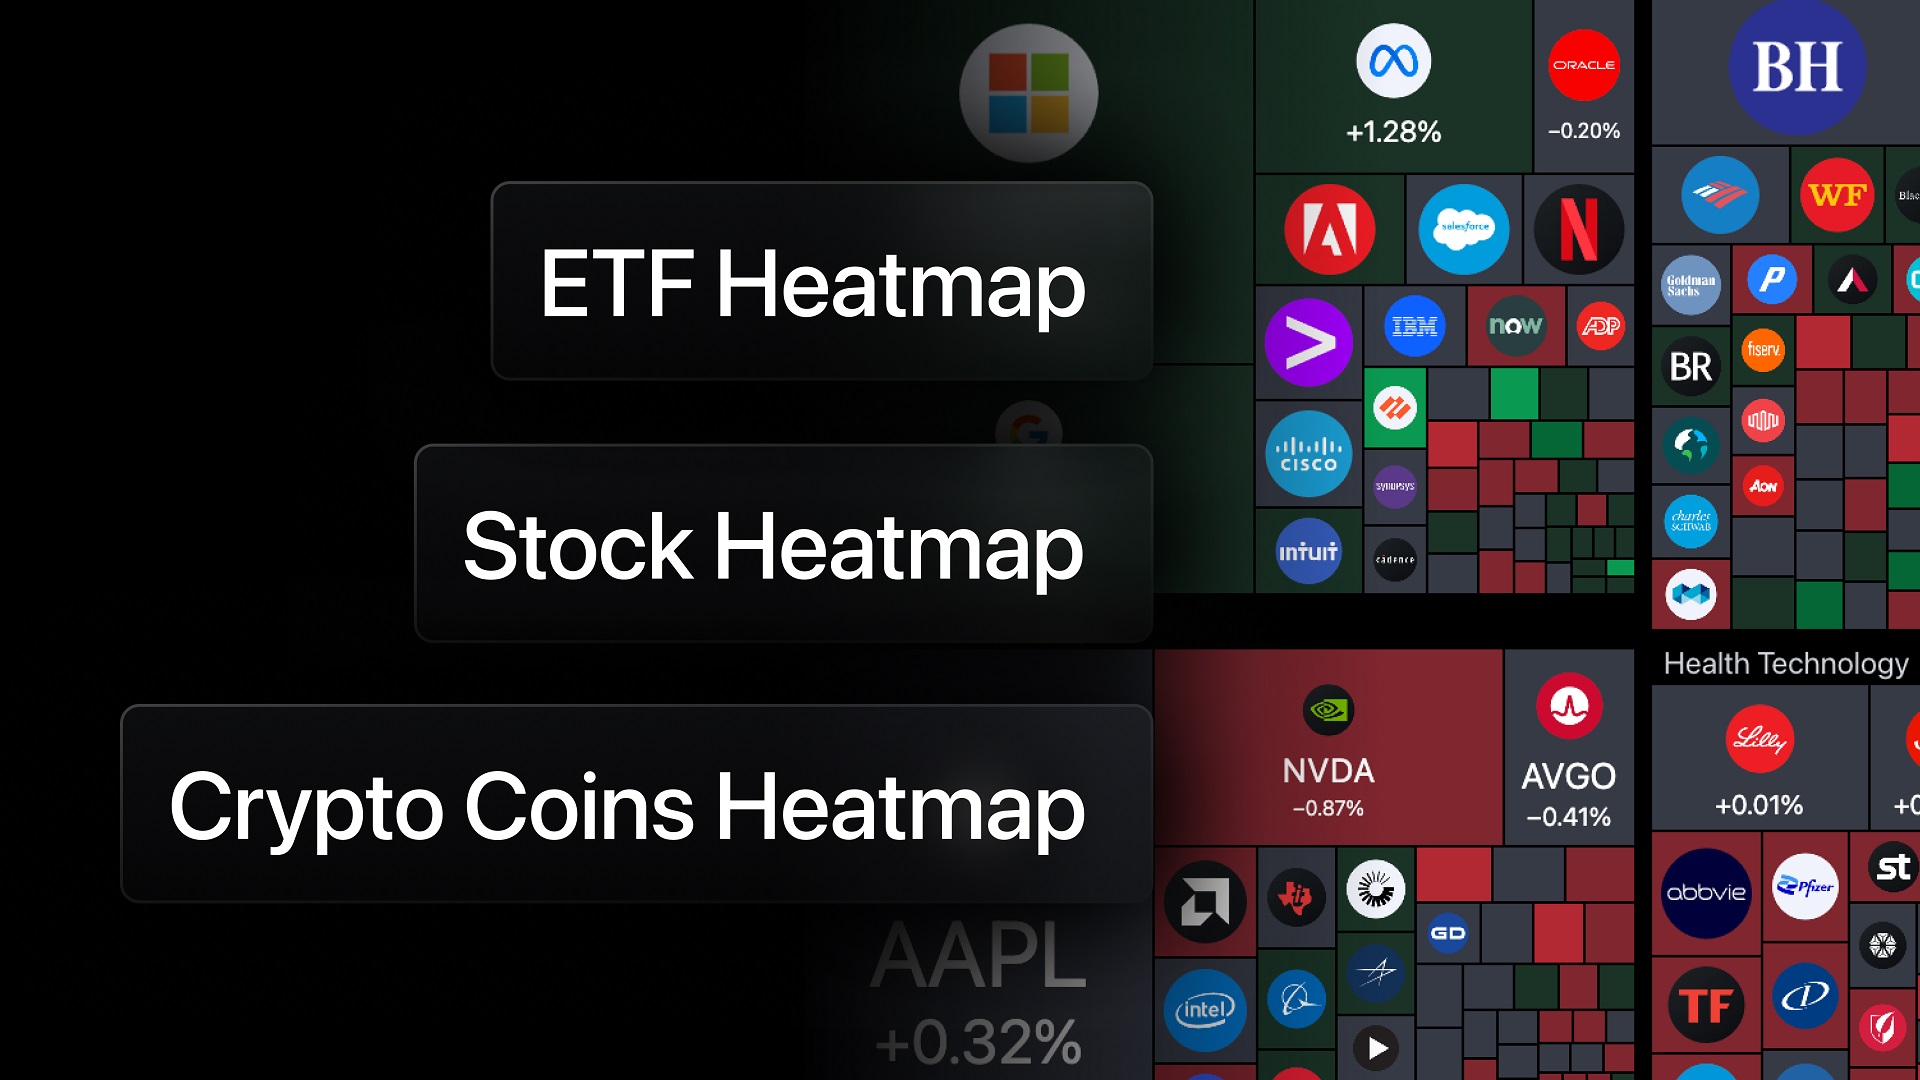
Heatmaps are a quick way to spot sector-wide or market-wide strength and weakness before you drill into individual charts. If the entire tech sector is deep red and one stock is bright green, that’s worth investigating. If everything in crypto is light green except a few dark green outliers, those outliers might be where the momentum is concentrated. Think of the heatmap as a high-level view that tells you where to look next.
How to use paper trading on TradingView
Paper trading is TradingView’s built-in simulator that lets you practice with virtual funds. No real money is at risk, which makes it the right place to test strategies before committing capital.
- Open the Trading Panel. Click the Trade button in the top toolbar to reveal the panel below the chart.
- Select Paper Trading. In the broker list that appears, choose Paper Trading. TradingView connects you to a simulated account with virtual funds.
- Place orders. Buy and sell just as you would with a real broker. You can use market orders, limit orders, stop-loss orders, and take-profit orders. Click on a price level or use the order entry panel to set your parameters.
- Monitor and manage positions. Your open positions, pending orders, and trade history all show up in the Trading Panel you opened earlier. You can modify orders, adjust stop levels, or close trades from there.
- Review your results. Track how your strategy performs over time. Paper trading builds familiarity with order types and helps you develop confidence in your approach before you switch to a funded account.
TradingView also hosts risk-free trading competitions where participants test strategies against each other and can win real-money prizes, which adds a practical incentive to sharpen your paper trading skills.
Connecting a broker to TradingView
Once you’re ready to trade with real money, you can link a broker account directly to TradingView.
- Open the Trading Panel. Click the Trading Panel button at the bottom of the Supercharts page. A list of supported brokers appears.
- Select your broker. Find your broker in the list, click Connect, and log in with your broker credentials.
- Confirm the connection. TradingView links the accounts automatically. You’ll see your account balance and positions populate in the Trading Panel.
From this point, trades you place on TradingView route through the broker for execution. TradingView doesn’t hold your funds or process the trades itself. It acts purely as a front-end interface, while your broker handles the actual order filling and settlement.
You can switch between a live account and a demo account from the Account dropdown in the Trading Panel. This is useful if you want to test a new strategy in demo mode before running it live. For an official walkthrough of the broker connection process, TradingView’s support documentation covers each step in detail (TradingView Support).
How to place trades on TradingView
Before placing a trade, make sure you’ve selected the broker-specific version of the symbol. TradingView often shows data from multiple exchanges for the same asset, and your order needs to be on the version tied to your connected broker.
Click “Buy Market” (offer) to go long or “Sell Market” (bid) to go short. Enter your position size, choose the order type (market, limit, or stop), and optionally set take-profit and stop-loss levels. Setting a stop-loss at the time of entry is a habit worth building early, because it removes the temptation to move it later when a trade goes against you.
Once the order fills, your position appears in the Trading Panel. You can modify size, stops, or targets directly from there. Trade history is also accessible in the same panel, so you can review past executions without leaving the chart.
Backtesting strategies with the Strategy Tester
Backtesting applies a strategy to past market conditions to see whether it would have been profitable historically. It’s one of the most practical features on TradingView for anyone developing a systematic approach, though past results don’t guarantee future performance.
TradingView offers two ways to backtest. Manual backtesting uses the Replay tool. You scroll back in time to a chosen date, then step forward bar by bar or play at variable speed, simulating trades as if you were seeing the price action for the first time. This approach forces you to make decisions without the benefit of hindsight, which is closer to real trading conditions.
Automated backtesting uses strategy scripts. Apply a strategy script to a chart (you can find many in the Community Scripts library or write your own in Pine Script), and open the Strategy Tester panel. It runs the strategy across the entire visible history and reports metrics like net profit, win rate, max drawdown, and total number of trades. Max drawdown is worth paying attention to because it tells you the worst peak-to-trough loss you would have experienced, which is often the number that determines whether a strategy is actually tolerable to trade in real time.
Introduction to Pine Script
Pine Script is TradingView’s proprietary programming language for building custom indicators and strategies. It’s cloud-based, meaning scripts run on TradingView’s servers and use the platform’s data feeds rather than requiring anything on your local machine.
You access the Pine Editor from the bottom of the TradingView interface in the Personal section. The editor includes syntax highlighting and error messages that point you to the line causing trouble.
If you’ve never written code before, the best starting point is modifying existing community scripts rather than writing from scratch. Open a community script, study how it works, change a parameter, and see what happens on the chart. This approach gives you working examples to learn from. A beginner can do practical things with Pine Script relatively quickly: adjust the lookback period on an existing indicator, change the conditions that generate buy and sell signals, or combine two indicators into one custom study.
Scripts can generate visual buy/sell signals on the chart, draw custom overlays, or calculate proprietary metrics that the built-in indicator library doesn’t cover. Once you’ve built something useful, you can publish it to the community or keep it private in your account. Once published, a script can earn an Editors’ Pick badge if it meets TradingView’s quality standards.
For a broader overview of Pine Script capabilities alongside other TradingView features, ActivTrades has a useful primer that covers the basics.
TradingView community tools
TradingView’s community section lets users publish trade ideas with annotated charts and written analysis. Each idea appears in a social-media-style feed where other users can comment, like, and follow the author. Following experienced idea publishers is one of the faster ways to learn how other traders read the same charts you’re looking at.
Some traders take it further with live streaming, broadcasting their sessions so viewers can watch analysis happen in real time. It’s a passive way to pick up workflow habits and see how someone else uses the tools.
The right sidebar also includes a news feed that aggregates market headlines, giving you quick access to breaking developments without switching to another site. Below that, the Economic Calendar tracks upcoming macro events like earnings reports, interest rate decisions, and economic data releases. Knowing when these events are scheduled helps you avoid getting caught off guard by sudden volatility.
Community Scripts round out the social layer. The Editors’ Picks section curates the strongest community-built indicators, each reviewed for reliability before being highlighted.
TradingView pricing plans: free vs paid
TradingView offers a free plan and five paid tiers above it. All paid plans are available on monthly or annual billing, with annual billing coming at a discount.
| Feature | Free | Essential | Plus | Premium |
|---|---|---|---|---|
| Indicators per chart | Limited | Increased | Higher | Highest for individuals |
| Active alerts | Limited | Increased | Higher | Highest for individuals |
| Multi-chart layouts | No | No | Yes | Yes |
| Auto chart patterns | No | No | No | Yes |
| Priority data | No | No | No | Yes |
| Community content | Yes | Yes | Yes | Yes |
| Paper trading | Yes | Yes | Yes | Yes |
Professional-tier plans also exist above Premium for institutional-level needs, though most individual traders won’t need them.
The free plan is genuinely useful for learning. You can chart, use a handful of indicators, set a few alerts, browse community content, and paper trade. Where you’ll feel the limits is when you want to layer five or six indicators on one chart, run alerts on more than a few setups at once, or view multiple charts side by side.
The Essential plan loosens those restrictions and is a reasonable first upgrade. Plus adds multi-chart layouts, which matter once you’re watching several markets at the same time. Premium is where you get auto chart pattern recognition and the highest individual limits, making it the plan for traders who rely heavily on the platform’s tools throughout the day.
TradingView on mobile vs desktop
The desktop app, available for Windows 10 or 11, macOS Catalina 10.15 and later, or Ubuntu/Debian Linux, supports native multi-monitor setups and synchronized crosshairs across screens. If you trade with two or three monitors, the desktop app handles that setup natively, which the browser version can’t match easily.
The browser version requires no download and works on any operating system with a modern browser. It’s convenient for quick checks or when you’re on a machine you don’t own, and it gets all the same features as the desktop app.
The mobile app covers the essentials: charting, alerts, watchlists, and order management. It’s practical for monitoring positions and getting alert notifications on the go. But complex multi-chart analysis, drawing-heavy workflows, and strategy backtesting are more practical on desktop or at least a larger screen. Fine-tuning a Fibonacci retracement with your thumb on a phone screen is technically possible, but it isn’t pleasant.
For most traders, the desktop app or browser serves as the primary workspace, and the mobile app fills in when you’re away from your desk.
Tips for getting started with TradingView
At AXL Research Hub, we’ve seen new traders get the most out of TradingView when they resist the urge to use everything at once. Here are the habits that make the learning curve shorter.
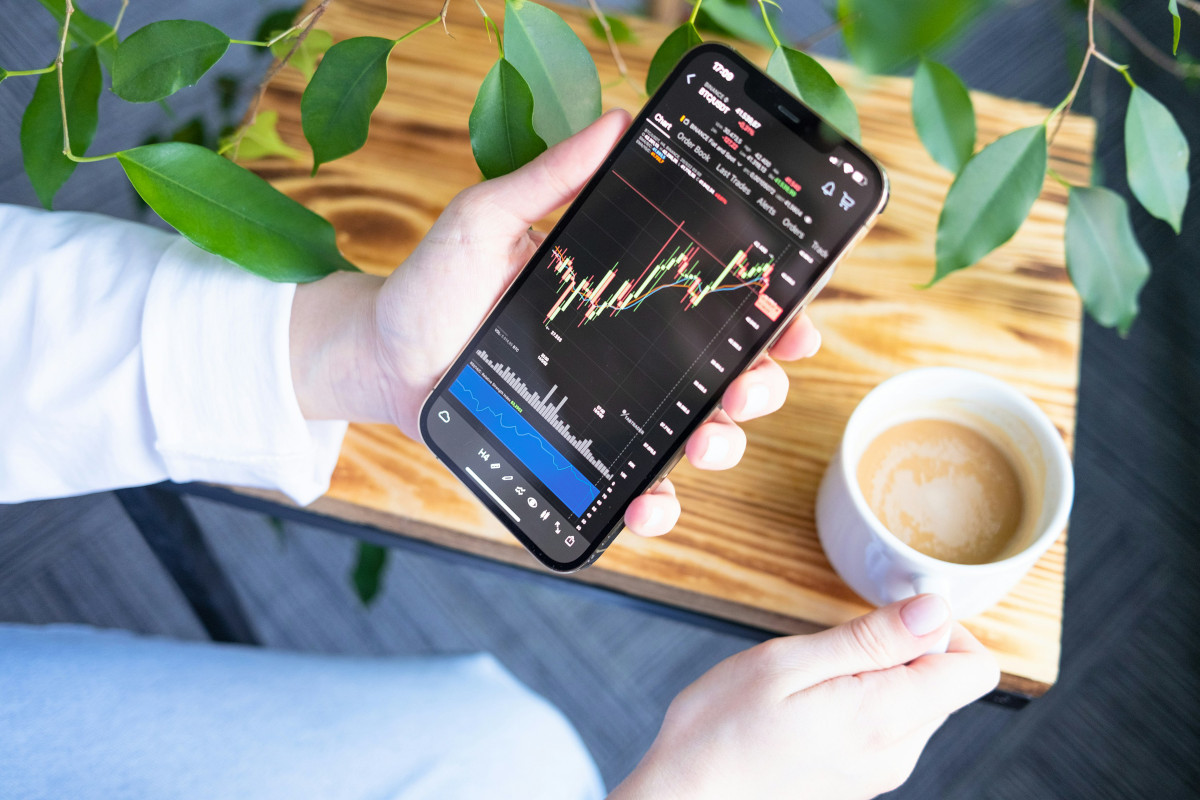
- Learn the basics of technical and fundamental analysis first. TradingView’s tools are powerful, but they’re only useful if you understand what the indicators and chart patterns are telling you. TradingView provides educational resources in its support section that cover the fundamentals.
- Start with paper trading. Test your strategies with virtual funds before putting real money on the line. Paper trading builds the muscle memory of placing orders, setting stops, and managing positions without the financial risk.
- Use Editors’ Picks or Top-rated filters for community scripts. The community library has over 100,000 custom indicators. Not all of them are reliable. Narrowing your search to Editors’ Picks or Top-rated helps you find scripts that other traders have already put through their paces.
- Set cloud-based alerts. Because TradingView processes alerts on its own servers, you’ll still get notified even if the platform is closed on all your devices. Set alerts on key levels so the market comes to you instead of requiring you to watch every candle.
- Customize your colors. Changing candle colors and background to something easier on your eyes reduces visual fatigue and can actually make patterns easier to read. Dark mode is a good starting point.
- Keep your indicator count manageable. Stacking too many indicators on one chart creates conflicting signals and clutters your view. Start with two or three that complement each other, learn them well, and add more only when you have a specific reason.
Frequently asked questions
Can you make money on TradingView?
TradingView is a charting and analysis tool, not a money-making system. It gives you the tools to analyze markets and place trades through a connected broker, but profitability depends entirely on your strategy, risk management, and market conditions. No platform can guarantee profits.
What is the most powerful indicator on TradingView?
No single indicator guarantees results, and anyone claiming otherwise is selling something. Commonly favored indicators include RSI for momentum, MACD for trend direction, Bollinger Bands for volatility, and VWAP for intraday price context. Each one suits different strategies and market conditions, so the “best” indicator depends on how you trade.
Is TradingView safe?
TradingView uses standard security measures including two-factor authentication. Importantly, it doesn’t hold your funds. Your money stays with your connected broker, and TradingView only serves as the interface for analysis and order routing.
Can TradingView move the market?
TradingView itself can’t move prices. It’s an analysis tool. However, with over 50 million users worldwide as of 2025, large numbers of traders reading the same technical signals and acting on them at the same time can collectively influence price action. That’s a feature of crowd behavior in markets, not something unique to any one platform.
Choosing your next step after setup
If you’ve just created your TradingView account, the single best next step is opening a paper-trading position. Don’t wait until you feel ready. Pick one asset, apply a candlestick chart with one or two indicators (RSI and a moving average are a solid pair to start with), and place a simulated trade. You’ll learn more in 30 minutes of paper trading than in hours of reading.
Once you’re comfortable with the interface, head to the community section and follow a few experienced idea publishers. Watching how they annotate charts and explain their reasoning fills in gaps that tutorials can’t cover.
When you’re ready to trade with real capital, linking a funded broker account turns TradingView from a charting tool into a full trading workstation. If you trade crypto specifically, reviewing the best crypto exchanges can help you choose a platform that integrates smoothly with TradingView. The transition is straightforward since the order placement and position management work exactly the same way they did in paper trading.