


Range trading is a way to profit from a market that’s moving sideways: you buy near a price floor and sell near a price ceiling, again and again, until the pattern breaks. It works well when prices stay boxed in. It can hurt fast when they don’t, so the real skill is spotting a genuine range and knowing when it’s over.
What is range trading?
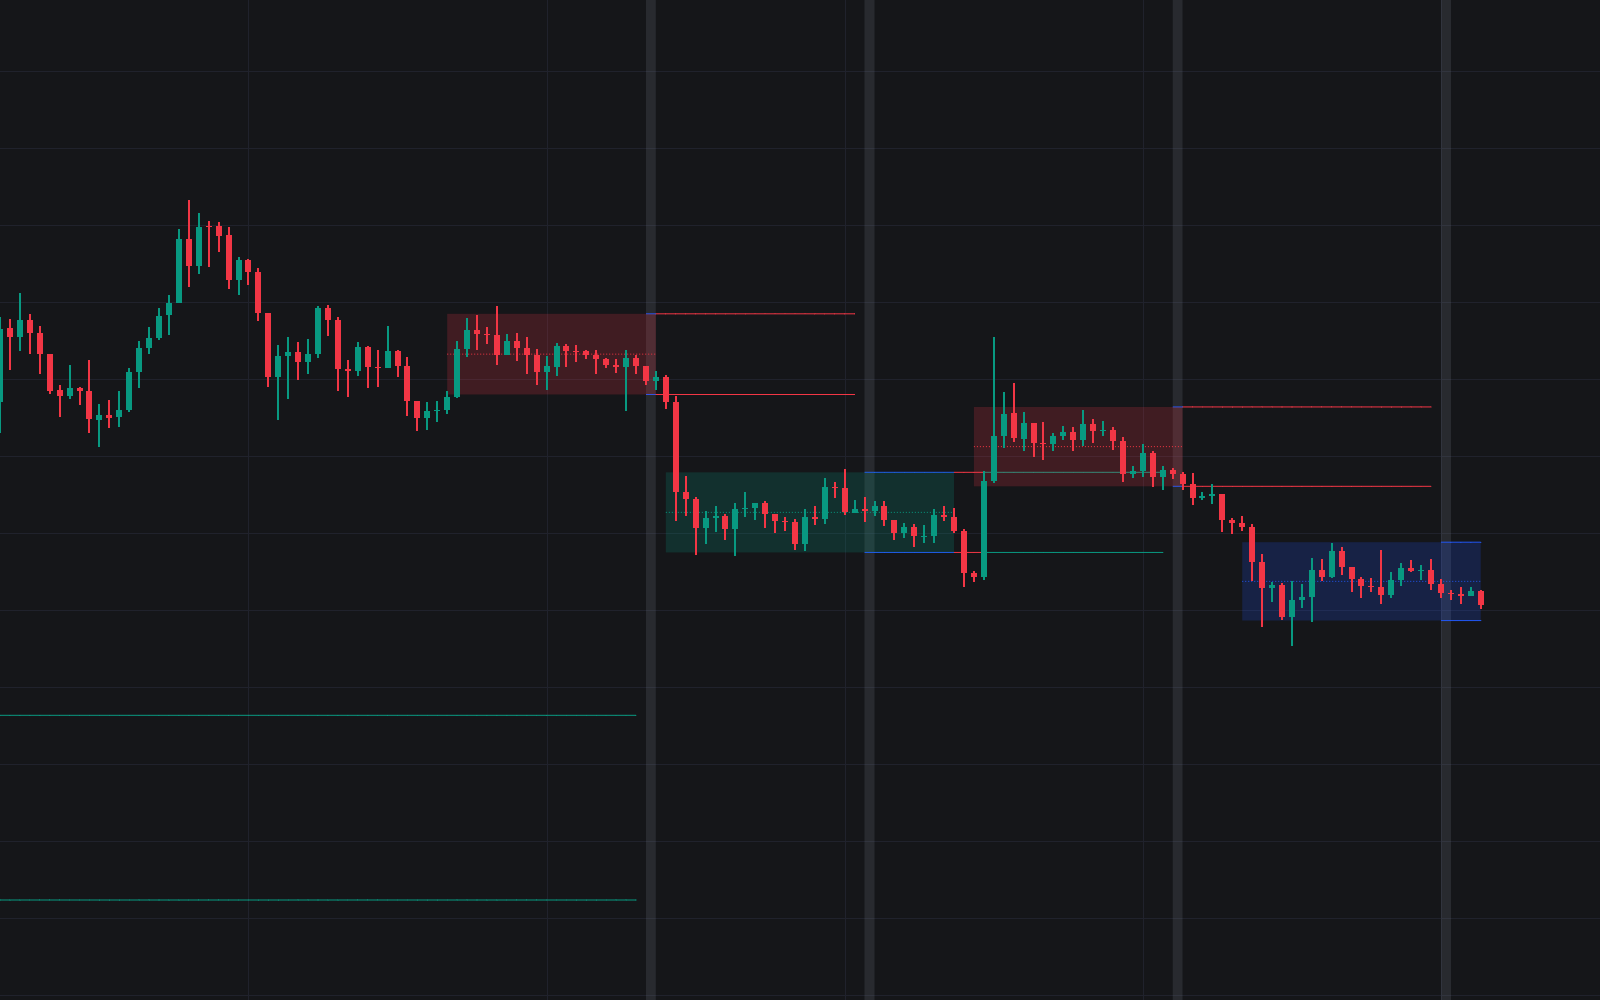
Range trading is an active trading strategy where you buy near a market’s support and sell near its resistance, profiting as price swings back and forth between those two horizontal boundaries. You can also run it in reverse by shorting near resistance and covering near support. Either way, the trade only works while price stays inside the box.
Support is the floor of the range. As price drops toward it, buyers get more aggressive and sellers start running out of supply. That shift is what stops the decline. Resistance is the ceiling. Up there, selling pressure overwhelms buying and caps the rally.
Because price rarely turns at the same penny twice, and it’ll often poke a little past a level before reversing, it’s better to treat both as zones rather than exact prices. If you draw support as one thin line, you’ll read every small overshoot as a breakdown and get shaken out of good trades.
Here’s what a simple range trade looks like. Say a stock keeps finding buyers around $35 and keeps stalling around $40. A range trader buys near $35 and sells near $40. Then they repeat that cycle over several weeks, for as long as both levels hold.
Markets move in two modes: a trending phase, where price expands in one direction, and a consolidating phase, where it contracts and drifts sideways. They spend most of their time in that second mode, which is a big part of why range trading has so many followers.
Where you trade inside the range matters as much as spotting it. Near the boundaries, your stop can sit close while your target sits on the far side of the range. In the middle, price has no edge in either direction. Your potential loss there is about as big as your potential gain, which makes for a poor risk-reward ratio.
Short-term traders, scalpers, and those who practice day trading like range trading because the setups repeat. Swing traders use it too. When a range is wide enough, they’ll hold positions for days, weeks, or multi-month swings.
Since you map the levels ahead of time, a lot of the work can run by itself. You can rest limit buy orders near support and limit sell orders near resistance. After that, price comes to you, and you don’t have to watch every tick.
How do you establish whether a market is rangebound or trending?
A market is rangebound when its highs top out near the same level, its lows bottom out near the same level, and price has bounced off both several times without going anywhere. If the highs keep climbing or the lows keep falling, you’re in a trend. Flat moving averages back up a range read.
Start with trendlines. Connect the recent highs, then connect the recent lows. Flat, horizontal lines linking similar highs and similar lows describe a range. Lines that slope because they connect higher highs or lower lows describe a trend. Selling at what looks like resistance inside an uptrend is one of the quickest ways to lose money with this strategy.
Next, count the touches. A valid range needs price to bounce off support and resistance multiple times without making directional progress. One bounce off a high and one off a low only gives you two points. Two points can just as easily be a pause inside a trend. The more times both sides have held, the more you can trust the range.
Moving averages give you a quick second opinion. When they flatten out and price weaves back and forth through them, the market’s consolidating. When they tilt up or down, a trend is in control. That rules out range setups, no matter how neat your horizontal lines look.
At the boundaries themselves, watch for reversal candles. A hammer or inverted hammer at support points to sellers running out of steam. A shooting star at resistance points to buyers fading. A doji can show up at either edge and signals indecision. Don’t act on the pattern alone, though. Wait for the next session’s candle to confirm the turn.
The FTSE 100 gives a clean example. One range on the index had support around 8,050 and resistance around 8,400. An inverted hammer formed around the 8,000 level, and a bullish session candle followed it. Notice that the reversal printed a bit below the support figure. That’s exactly why you treat support as a zone.
Volatility tells you whether a range is likely to stay stable. Contracting Bollinger Bands point to smaller price swings. So do falling Average True Range (ATR) readings. Ranges tend to hold up best in calm conditions like these.
Timing matters too, especially in forex. The Asian forex session usually carries less directional momentum than the London or New York openings. The midday lull in equity and forex markets is quieter as well. If you range trade intraday, those slower windows tend to respect boundaries better.
Finally, stick with liquid instruments. Major forex pairs such as EUR/USD, GBP/USD, and USD/JPY go through clear ranging periods. Large-cap stocks behave the same way. Because institutions trade these markets steadily, they respect historical technical zones more consistently. Illiquid assets are different, since a single big order can blow straight through a level.
What is the best indicator for range trading?
There’s no single best indicator for range trading. Range traders combine a trend-strength filter such as ADX, mathematical price levels such as pivot points, a momentum oscillator such as RSI, and a volume read. Each one covers a gap the others leave open. A signal that shows up on several at once carries far more weight.
If we had to pick one place to start, it’d be ADX. It tells you whether a range trade makes sense in the first place.
Average Directional Index (ADX)
The Average Directional Index is a single line plotted below the price chart. It measures how strong a trend is, regardless of direction. A strong downtrend and a strong uptrend can produce the same reading.
For range traders, three thresholds do most of the work:
- Below 20: the trend is weak or non-existent.
- Below 25: conditions are rangebound.
- Above 25: trend momentum is strong.
A low, flat ADX is your green light. When the line starts climbing through 25, directional momentum is building and a breakout may be on the way. That’s your cue to tighten up or step aside instead of adding new positions at the boundary.
ADX comes with two companion lines, +DI and -DI. In a trend, one tends to stay above the other. When they keep crossing back and forth, price is chopping sideways. That backs up what a low ADX reading is already telling you.
USD/JPY in 2022 shows the warning in action. The pair had been stuck in a 114-115 range. ADX rose above 25 in February 2022, and price broke out of the range in March 2022. The driver was diverging interest rate policy between the Federal Reserve and the Bank of Japan. Anyone watching ADX got advance notice before the range gave way.
Pivot points
Pivot points are price levels calculated from the previous trading day’s intraday high, intraday low, and close, then projected onto the current session. They mark zones where price has tended to run out of steam. Traders set entry and exit orders around them.
The standard setup has seven lines, and charting platforms like TradingView plot them automatically. The central pivot (P) sits in the middle. Three support levels (S1, S2, S3) sit below it, and three resistance levels (R1, R2, R3) sit above.
Each pair of neighboring lines works like a small range of its own. You might go long at R1 and close at R2. Or you might go short at R2 and close at R1. One day’s pivot map can give you several trades this way.
Oscillators: RSI, Stochastic, and CCI
The Relative Strength Index (RSI) compares average gains on up-close days with average losses on down-close days. It plots the result on a 0 to 100 scale.
At support, an RSI reading below 30 suggests the market’s oversold and could bounce. For stricter confirmation, wait for RSI to dip below 20 and then turn back up. Resistance works the other way. A reading above 70 signals overbought conditions and a possible pullback. The stricter version is a reading above 80 that starts falling.
The Stochastic Oscillator helps with timing. When its two lines cross inside the overbought or oversold zone, that crossover adds weight to a reversal at the boundary.
The Commodity Channel Index (CCI) marks exhaustion at the edges of a range. A reading below -100 points to oversold conditions. A reading above +100 points to overbought.
Every oscillator needs a horizontal level behind it. In a strong trend, price can stay overbought or oversold for a long stretch, and an overbought reading by itself won’t stop a rally. Use oscillators to confirm a boundary you’ve already mapped. Never use them as a reason to trade in open space.
Volume indicators and On-Balance Volume (OBV)
Volume shows how much conviction sits behind a move toward support or resistance, and it often shifts before price does. In a healthy range, volume fades as price drifts toward a boundary. Then it picks up after price bounces back inside. That pattern tells you the push into the level didn’t have much fuel.
A volume spike right at a boundary means something else. Heavy trading hit the level, and it still held. That’s strong rejection, and the range has survived a real test.
On-Balance Volume (OBV) keeps a running total, adding volume on up days and subtracting it on down days. Watch for OBV rising while price goes sideways. Buyers are quietly accumulating in that case, so expect an upside breakout rather than another trip down to support.
Volume also settles the breakout question. A break of support or resistance on high or expanding volume confirms a true breakout. A break on low volume is more likely a false breakout, and price often drifts back inside the range.
How to execute a range trading strategy
A range trade uses two timeframes. The higher one confirms that the range exists, and the lower one times your entry. Skip the higher-timeframe check and you might short what looks like resistance on a 15-minute chart while the daily chart is in a clean uptrend.
- Confirm the range on a higher timeframe. Pull up a 4-hour or daily chart for the bigger picture. You want ADX below 25 and flat moving averages. If either one says trend, there’s no range trade.
- Map your levels on a lower timeframe. Drop to a 15-minute or 1-hour chart. Mark the horizontal support and resistance zones, the pivot points, and any intermediate sub-range levels inside the band. Those inner levels become your partial-profit targets.
- Wait for price to reach the outer zone and show rejection. Look for confirmation from an oscillator (RSI, Stochastic, or CCI), a reversal candlestick, or orders accumulating in the order book. If your platform shows Time & Sales data, large trades printing at the level without price breaking through tell the same story: someone’s absorbing the pressure.
- Enter near the boundary. Go long near support or short near resistance. If the higher timeframe leans bullish, give long setups priority and be pickier with shorts.
- Set your stop just outside the zone. Put the stop-loss order just beyond support or resistance. You can also size it with the Average True Range (ATR) so it adjusts to current volatility. Aim for a 1:2 or 1:3 risk-reward ratio, and skip the trade if the range is too narrow to give you that.
- Scale out. Take partial profits at the mid-range level and close the rest at the opposite boundary. If price breaks out on high volume instead, switch what’s left to a trailing stop and let the move run.
The risk-reward target carries more weight than it looks. At 1:2, you risk one dollar to make two. That means you can lose more trades than you win and still come out ahead over time, as long as you keep the ratio honest on every entry.
Range trading across different asset classes
Ranges form and break differently depending on the market. Market structure, volatility, and the kind of news that moves prices all change from one asset class to the next.
Forex and currency crosses
Non-USD crosses that pair two stable, closely linked economies tend to range more smoothly than USD pairs. Their swings also run smaller. EUR/CHF is a classic case, held steady because the EU and Switzerland have stable economies. AUD/NZD is another.
When policy lines up, these boundaries stay flat. When both central banks move in step and the interest rate differential stays stable, neither currency has much reason to trend.
The catch is that a surprise can break a currency range fast. An unexpected central bank intervention can tear through levels that held for a long time. A geopolitical shock can do the same. Keep an economic calendar open and respect your stops.
Stocks and stock indices
Individual stocks, bonds, closed-end funds, and ETFs often consolidate in short-term horizontal bands. That happens even while the broader market drifts higher over the long run.
Major indices such as the S&P 500, NASDAQ, and FTSE 100 go through their own consolidation phases. These tend to show up during low-growth stretches. They also show up ahead of central bank announcements and corporate earnings reports.
That long-term upward bias changes how you trade an index range. Buying at support lines up with the market’s natural drift. Shorting at resistance means betting against it. Many range traders skip the short side on indices entirely and wait for the next trip down to support.
Commodities and cryptocurrencies
Commodities form cyclical ranges when supply and demand are in balance. Gold, silver, and crude oil all go through these phases. They also break out sharply on geopolitical events, weather, or inventory shocks. Crude oil is especially sensitive to OPEC decisions and oil inventory reports.
Bigger swings mean you’ll need wider stop-loss orders. Smaller position sizes keep your dollar risk the same with those wider stops. Keep an eye on MACD and RSI, and track inventory data too, since a surprise report can turn a quiet range into a trend quickly.
Cryptocurrencies move in directional waves, with sideways consolidation phases in between. During those phases, horizontal support and resistance guide your entries the same way they do in other markets. The order book adds a layer you can see directly. Thick clusters of resting orders near a level show where buyers or sellers are defending it.
Thin order books cut the other way. One large order can push price through a level and snap right back, so give crypto zones a bit more room. Depth varies from one exchange to the next. If you’re still choosing where to trade, our crypto exchange rankings make a reasonable starting point.
Comparing range trading with other trading strategies
Each of these four strategies needs a different kind of market to work. Matching the strategy to the chart in front of you matters more than mastering any single one.
| Strategy | Core objective | Ideal market condition | Primary tools | Entry trigger |
|---|---|---|---|---|
| Range trading | Capture oscillations between horizontal boundaries | Sideways consolidation with low volatility and ADX below 25 | Horizontal support/resistance, pivot points, RSI, Stochastic, OBV | Price bounce and rejection at support or resistance |
| Trend trading | Follow sustained directional movement | Uptrend (higher highs and lows) or downtrend (lower highs and lows) with rising volume and ADX above 25 | Moving averages, sloping trendlines, ADX | Pullback in the trend’s direction or trend continuation confirmation |
| Breakout trading | Capture new momentum as price exits a consolidation zone | Tight range consolidation followed by surging volume and expanding volatility | Volume spikes, widening Bollinger Bands, support/resistance levels | Decisive candle close above resistance or below support on high volume |
| Mean reversion | Profit from extreme price moves snapping back to a historical average | Sharp price deviation from a central moving average | Bollinger Bands, standard deviation channels, moving averages | Price touching or exceeding the outer standard deviation bands |
Range trading and mean reversion get mixed up because both bet on a reversal. The difference is the reference point. A range trader reacts to fixed horizontal levels that price has tested before. A mean reversion trader reacts to how far price has stretched from a moving average, and that average can itself be sloping.
Breakout trading is the natural partner to range trading. The signs that end a range (surging volume, widening Bollinger Bands, a decisive close outside the zone) are the same ones a breakout trader waits for. If you know both approaches, you can switch when the range fails instead of fighting the move.
Risks, common pitfalls, and trading psychology
Range trades tend to go wrong in two ways. Either the market breaks out of the range, or you break from your plan.

Market risks and common mistakes
Your upside is capped on every trade. Because the opposite boundary is your target, a range entry gives up the chance to ride a big trend move in exchange for a close stop and a clear target.
Breakouts are the main threat. A true breakout runs through your stop and keeps going. A false breakout is a temporary push through support or resistance that reverses back inside the band. It can stop you out right before the trade would’ve worked. You can limit the damage from both by treating levels as zones, placing stops just beyond them, and checking volume on every breach.
Some mistakes happen before the first trade. Calling a range too early is a common one. Price pauses, you draw two lines, and you start trading before either boundary has been tested more than once. Wait until both sides have held multiple times.
Ignoring the warning signs is another. Widening Bollinger Bands suggest the sideways phase may be ending. Rising OBV and a decisive candle close outside the zone point the same way. Any one of them is reason enough to stop opening new positions at the boundary.
Then there’s overtrading in the middle of the range. Every extra trade adds transaction costs. Mid-range entries also come with worse risk-reward, because your stop and target end up about the same distance away. Use the middle of the range for waiting, not for trading.
Trading psychology and discipline
Sideways markets test your patience in ways trends don’t. Fear of a breakout is the classic problem. Price reaches support, and you hesitate because this might be the time it breaks. By the time you enter, price has already bounced. Your target is now closer and your stop is farther away, so your reward-to-risk has shrunk.
Your own results can knock you off course too. After a string of wins, it’s tempting to size up because the range “always works.” Then one breakout wipes out several trades’ worth of gains. After a loss, frustration pushes people into impulsive entries. Some widen their stops just to avoid being wrong again.
Rules hold up better than willpower here:
- Set price alerts at the boundaries. You only need to look when price reaches a zone, and that takes away the urge to trade the middle.
- Keep position size fixed. Using the same size on every trade stops a winning streak from quietly inflating your risk.
- Log every trade in a trading journal. Writing down the entry, the exit, and your reason shows you habits like late entries or mid-range trades that you won’t notice in the moment.
- Stay out after a breakout. Once price leaves the range, don’t re-enter until a new range or a clear trend forms.
Core rules for trading rangebound markets
Range trading pays when three conditions line up: horizontal support and resistance keep holding, volatility stays compressed, and ADX stays below 25. Run that check before every trade. If any one of them fails, stand aside until the market settles into its next pattern.
Let the boundaries choose your entries. Then make an oscillator like RSI, Stochastic, or CCI confirm them, along with volume. That pairing is how you filter out false breakouts. Keep your stop just outside the range and skip mid-range entries. Those two habits protect your capital on the day a sideways market turns into a trend. AXL Research Hub has more strategy guides like this one if you want to keep building your toolkit.