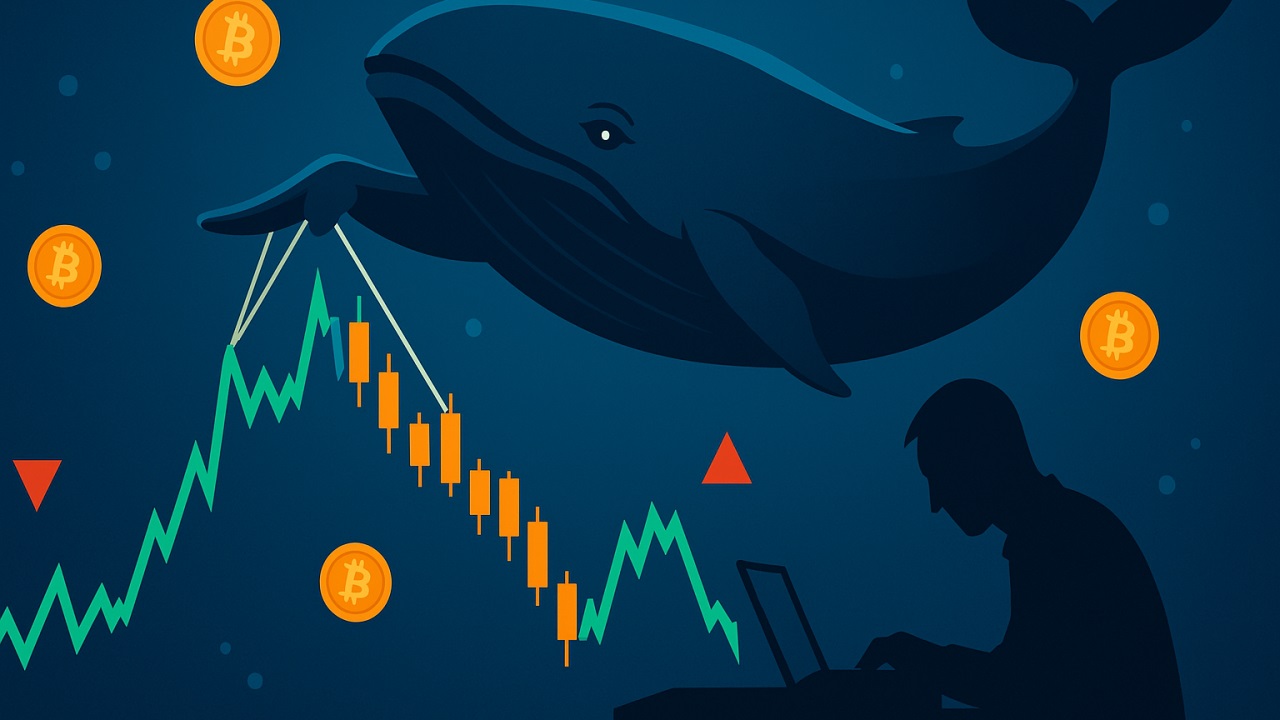

A single wallet moving thousands of Bitcoin can send prices lurching in minutes, catching smaller traders off guard. Knowing how they operate, what signals they leave behind, and how to read those signals puts you in a better position to react with a plan instead of panic.
What are crypto whales?
A crypto whale is any individual or entity holding enough cryptocurrency to move that asset’s price or liquidity with a single transaction. The term comes from traditional finance, where it describes investors or institutions whose positions are large enough to sway an entire market.
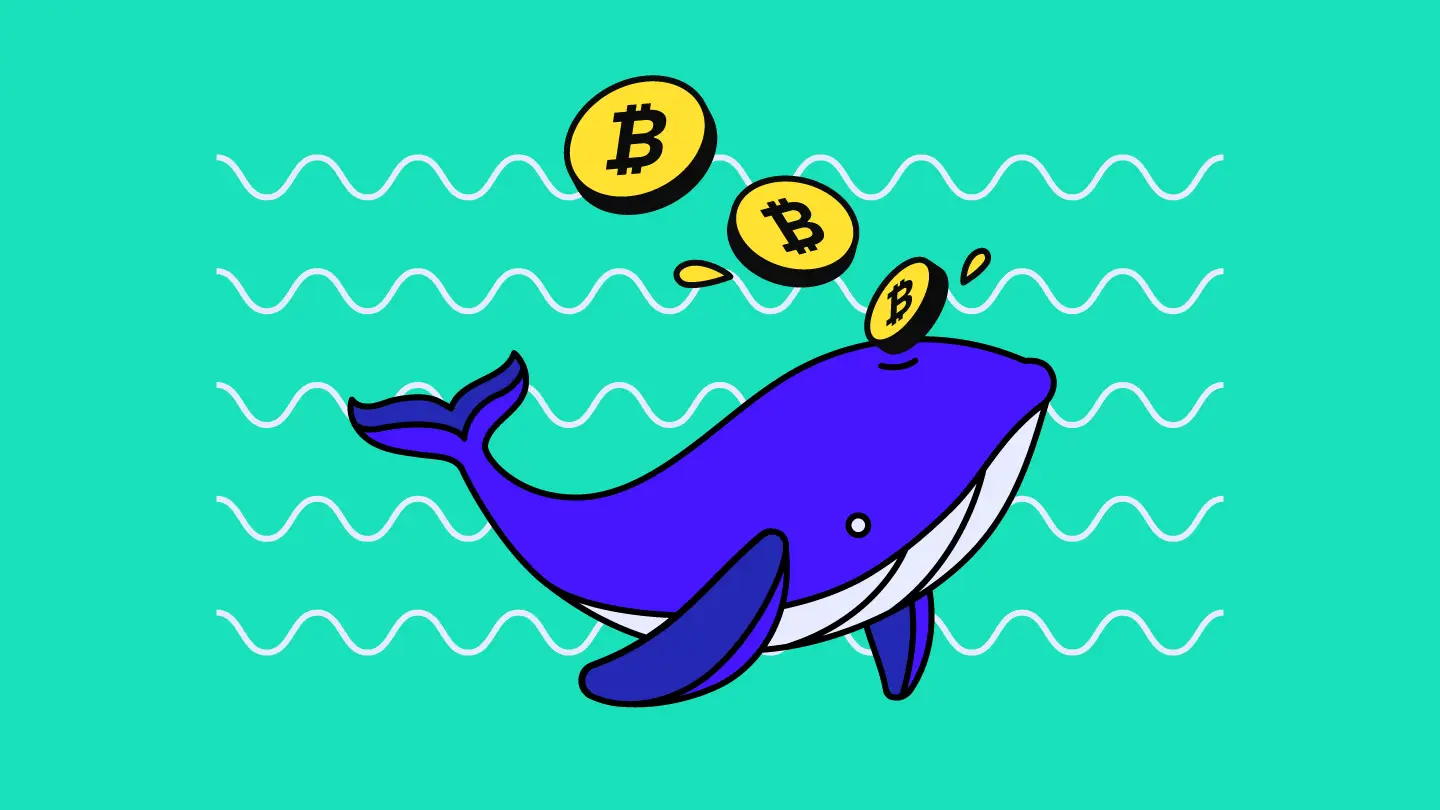
There’s no universal dollar amount or coin count that officially qualifies someone as a whale. The community applies the label relative to a token’s total supply and how deep its order books run. For Bitcoin specifically, holding at least 1,000 BTC commonly places a holder in whale territory by community convention, but for a smaller-cap token, a much lower figure could carry the same outsized influence.
Whale profiles vary widely, ranging from early adopters who acquired coins when prices were negligible to blockchain founders who retained large token allocations from the start. Institutional investors have entered the picture as well, with hedge funds and corporate treasuries now holding significant positions. On top of that, exchange platforms themselves manage enormous reserves across hot and cold wallets, which often makes them some of the largest holders on any given chain.
One thing that sets crypto apart from traditional markets is transparency. Whale transactions are recorded on public blockchains, so anyone with the right tools can watch them happen in real time. That visibility creates an information layer that simply doesn’t exist in stock or bond markets, where large institutional trades can stay hidden for days or weeks.
How much crypto do you need to be a whale?
Bitcoin holders are informally ranked on a marine-life scale that ranges from the smallest participants to the largest. The community treats these tiers as approximate BTC ranges that quickly communicate how much influence a given wallet might carry, not as hard cutoffs.
| Tier | Approximate BTC held |
|---|---|
| Shrimp | Less than 1 BTC |
| Crab | 1 to 10 BTC |
| Octopus | 10 to 50 BTC |
| Fish | 50 to 100 BTC |
| Dolphin | 100 to 500 BTC |
| Shark | 500 to 1,000 BTC |
| Whale | 1,000 to 5,000 BTC |
Accounts above the whale tier are sometimes called humpbacks. These represent the very largest holders, often exchange cold wallets or early protocol treasuries that accumulated coins before anyone was paying attention. Equivalent thresholds exist for other tokens, but they shift depending on total supply and tokenomics. A whale-level position in Ethereum looks very different from one in a low-cap altcoin with a fraction of the liquidity.
The value of these labels isn’t precision. It’s shorthand. When an analyst says “shark-level accumulation is rising,” the community immediately understands the scale being discussed without needing exact wallet balances.
How crypto whales move the market
Whales affect crypto markets through several distinct mechanisms, from raw price pressure to subtler plays on sentiment and governance. Breaking these apart helps you interpret whale-driven events on their own terms rather than reacting emotionally to a price candle.
Price volatility
A single large sell order floods the market with supply, and the price drops as buy orders at lower levels get filled. A large buy order does the opposite, absorbing available supply and pushing the price up. These moves happen fast, and they tend to cascade. Stop-loss orders fire, retail traders panic-sell or chase the move with fear-of-missing-out buys, and the original price shift gets amplified well beyond what the whale’s order alone would have caused.
Price can also react before any follow-up trade happens. When a whale transaction shows up on a public alert feed and gets shared on social media, the market often moves on the news itself. Traders front-run what they assume the whale will do next, which means the publicity around a move can be just as powerful as the move.
One metric that analysts watch for early signs of whale selling is exchange inflow mean, which measures the average deposit size flowing into exchanges. When this metric rises above 2.0 and correlates with heavy exchange usage, market observers interpret it as a signal that whales may be preparing to offload. It doesn’t confirm a sell-off on its own, but it raises the probability enough to warrant attention.
Liquidity drain
Liquidity describes how easily an asset can be bought or sold without a big price impact. When whales hold coins idle in cold storage, that supply leaves active circulation. The pool of tokens available for trading shrinks, and the market becomes thinner.
In a thinner market, slippage increases. Slippage is the gap between the price you expect when you place a trade and the price you actually get when it executes. Even a moderate-sized order can cause an outsized price swing when liquidity is low, which puts retail participants at a disadvantage. You’re paying more to buy and receiving less when you sell, all because a handful of large holders have parked their coins off the active market.
This effect compounds over time. The longer whales sit on dormant holdings, the more fragile the order book becomes for everyone else.
Market manipulation tactics
Two tactics come up repeatedly in whale-driven manipulation: spoofing and wash trading. Both distort the order book and make price discovery unreliable for everyone else.
Spoofing involves placing a large buy or sell order with no intention of filling it, which creates a false impression of demand or supply that leads other traders to adjust their positions. Once those traders have moved, the whale cancels the original order, leaving them in unfavorable positions. You can spot potential spoofing by watching for sudden order-book walls, large limit orders at key price levels, that vanish right before they’d be executed. A massive sell wall that appears and disappears within seconds is a red flag worth noting.
Wash trading takes a different approach. The whale simultaneously buys and sells the same asset, often across accounts they control, to inflate volume figures. High volume attracts attention from technical-analysis tools and retail traders who read volume as a sign of genuine interest. But the interest is artificial. Recognizing wash trading is harder from the outside, though volume spikes that don’t come with real price movement are one tell. If a token’s 24-hour volume doubles but the price barely moves, the activity may not be organic.
Sentiment shifts
Whale moves don’t just affect prices directly. They shape how the rest of the market feels. Large withdrawals from crypto exchanges to private wallets are generally read as bullish because they suggest the whale intends to hold rather than sell. Large deposits onto exchanges get the opposite reading: the whale may be preparing to sell.
These interpretations spread fast on social media and in crypto chat groups, and they can become self-fulfilling. If enough people see a whale withdrawal alert and buy in response, the price rises before the whale has done anything else. The same feedback loop works in reverse: a deposit alert triggers fear, people sell, and the bearish interpretation plays out regardless of the whale’s actual intent. This is why context matters when you read whale alerts. Movement doesn’t always mean selling. Whales rotate wallets, shift between exchanges, consolidate addresses, or make large purchases. The direction of the transfer (onto or off of an exchange) is the first filter, but it’s not the whole story.
Crypto whales and blockchain governance
In Proof of Stake and similar governance systems, voting power scales with token holdings. That structure gives whales a disproportionate say in protocol upgrades, fee changes, and rule amendments. A single whale, or a small group coordinating their votes, can steer proposals toward outcomes that favor their own positions.
This raises real concerns about centralization within networks that are marketed as decentralized, because governance decisions that consistently benefit large holders at the expense of smaller participants make the project less attractive to new investors and developers. That loss of community trust can show up in the token’s price over time, even if no single vote triggers an immediate sell-off. For you as a smaller holder, it’s worth checking how voting power is distributed in any Proof of Stake project you’re invested in. A few wallets having outsized control over the protocol’s direction doesn’t doom a project, but it does mean the reality behind the scenes may not match the decentralized branding.
Who are the biggest crypto whales?
Exchange cold-storage accounts and reserve addresses holding customer funds actually make up many of the largest Bitcoin wallets, rather than individual traders. Other large-holder categories include wallets linked to early mining activity, protocol founders, and accounts holding seized or stolen coins that haven’t moved in years.
Concentration at the top is significant. As of August 2024, four Bitcoin wallets held 3.56% of all circulating BTC. That’s a substantial share of supply sitting in just a handful of addresses.
Some of the most watched wallets are dormant ones dating back to Bitcoin’s earliest days. One well-known example is address 198a-g3Hi, which holds 8,000 BTC, began acquiring Bitcoin on February 22, 2009, and has never made an outgoing transaction. As of August 30, 2024, that balance was valued at approximately $476 million. When a wallet like this suddenly moves funds after years of silence, it draws immediate attention. The market reads it as a potential signal that a very early holder, someone who has seen every cycle, is about to act. That interpretation, whether or not it’s correct, can drive price movement on its own. Dormant-wallet reactivation is distinct from routine whale activity because the time horizon is so extreme. A wallet that’s been quiet since 2009 carries different weight than an active whale reshuffling positions between exchanges.
Why the crypto community watches whale activity
Whale movements serve as a proxy for large-capital conviction. When wallets holding thousands of BTC start accumulating, it suggests that well-resourced players expect prices to rise. When those same wallets distribute, it can foreshadow broader downturns.
But movement alone doesn’t tell the full story. Whales may be rotating between wallets for security reasons, shifting funds to a different exchange for better rates, or making large over-the-counter purchases that don’t signal any directional view at all. That’s why experienced analysts monitor the number of transactions alongside their dollar value. A single large transfer to a cold wallet might be wallet maintenance. A series of large transfers in one direction, especially combined with on-chain metrics trending in the same direction, carries more meaning.
Whale tracking is one data layer among many, and the AXL Research Hub analysis approach treats it that way. It adds context to trading decisions, but it doesn’t replace fundamental analysis of a project’s technology, team, and adoption, or technical analysis of chart patterns and indicators. Treating whale data as confirmation rather than a standalone signal is the more reliable approach.
How to track crypto whale transactions
On-chain transparency means every transaction is recorded on a public ledger. Dedicated alert platforms scan blockchains and publish large transactions as they happen, including details like amount, token, sending address, and receiving address.

Alerts arrive through multiple channels. Depending on the platform, you can receive notifications via email, push notifications, Telegram, Discord, webhooks, or social media posts. Most services let you filter alerts by blockchain (Bitcoin, Ethereum, BSC, and others), specific token, or minimum transaction size, so you’re not drowning in noise from transfers that don’t matter to your positions.
Beyond simple alerts, whale-tracker dashboards show live analytics that go deeper than “a big transfer just happened.” These platforms display realized profit, potential profit, average buy price, HODL days, and USD transaction volume for tracked wallets. That level of detail turns a raw alert into something you can actually interpret: is this whale selling at a profit after a long hold, or moving coins they recently bought at a loss?
Mobile apps bring these signal feeds with you, offering price alerts, basic charting tools, and notification customization. If you’re actively trading and want whale data in real time, a mobile setup means you’re not tethered to a desktop dashboard.
Key on-chain metrics for reading whale behavior
Several on-chain metrics give you a structured way to interpret what whales are doing and what it might mean for the broader market. Each one measures something different, and they’re most useful when read together rather than in isolation.
- Realized profit compares the sale price of moved coins against the holder’s average buy price. Large positive spikes in this metric often appear near market tops, when long-term holders finally cash in. Large negative spikes tend to show up near capitulation bottoms, when holders sell at steep losses because they’ve lost confidence. If the average buy profit ratio is above 1.0, holders are selling at a profit on average. Below 1.0 means they’re selling at a loss.
- Potential profit estimates unrealized paper gains across all holders. When this metric reaches extreme highs, sell-offs have historically followed as holders lock in those gains. Near-zero or negative readings tend to mark accumulation zones, where prices are low enough that new buying picks up.
- Average buy price reflects the collective cost basis of all outstanding coins. When the market price drops below this line, the average holder is sitting in a net loss. That condition has historically coincided with bear-market bottoms, which makes it a reference point for gauging how much pain the market has absorbed.
- HODL days measures the average time coins stay in wallets before moving, weighted by balance. A rising number signals that supply is getting locked up and holders have conviction. A falling number signals distribution, meaning holders are moving coins more frequently, possibly to sell.
- USD transaction volume tracks the total value transferred across the network, excluding self-sends. Rising volume alongside rising price confirms demand. When volume falls while price keeps climbing, or vice versa, the divergence suggests the trend doesn’t have strong support underneath it.
None of these metrics works as a standalone buy or sell signal. Their value comes from layering: realized profit spiking while HODL days drop and exchange inflow mean rises above 2.0 paints a clearer picture than any one of those data points alone.
Watching the whales without swimming with them blindly
On-chain tools make whale activity more transparent than large-player moves in traditional markets, where institutional trades can stay hidden behind delayed filings and dark pools. That transparency is genuinely useful, but it comes with a trap: it’s easy to treat every whale alert as a signal to act.
The better approach is treating whale data as one input among several. Pair it with technical indicators, project fundamentals, and your own risk tolerance. A whale accumulating a token you’ve already researched and believe in reinforces your thesis. A whale dumping a token you hold might prompt you to re-examine your position, but it doesn’t automatically mean you should sell. The whales have their own timelines, their own tax situations, and their own strategies that you can’t fully see from a blockchain explorer. Watch them, learn from the patterns, but make the final call based on the full picture.