

Crypto prices don’t move in straight lines. They rise, pull back, rally again, and drop, forming peaks and troughs that repeat across days and weeks. Swing trading is a strategy built around those oscillations, aiming to capture short-to-medium-term price moves rather than riding a position for months or chasing minute-by-minute scalps. Bitcoin and major altcoins regularly produce 10 to 30% swings within 3 to 10 days, which is exactly the kind of movement swing traders look to profit from.
What is swing trading in crypto?
Swing trading is a trading strategy that captures short-to-medium-term price movements in cryptocurrency markets, with positions typically held for several days to several weeks. Unlike day trading, where every position opens and closes within the same session, swing trades stay open overnight or longer. And unlike HODLing, where you buy and hold through months or years of volatility, swing trading actively seeks to enter near the bottom of a price dip and exit near the top of the next leg up (or the reverse for short trades).
The typical hold period for a crypto swing trade averages 2 to 10 days. Price targets on moderate-volatility assets usually fall in the 3 to 15% range per trade, with stop-loss distances set 1 to 5% from entry depending on how volatile the asset is.
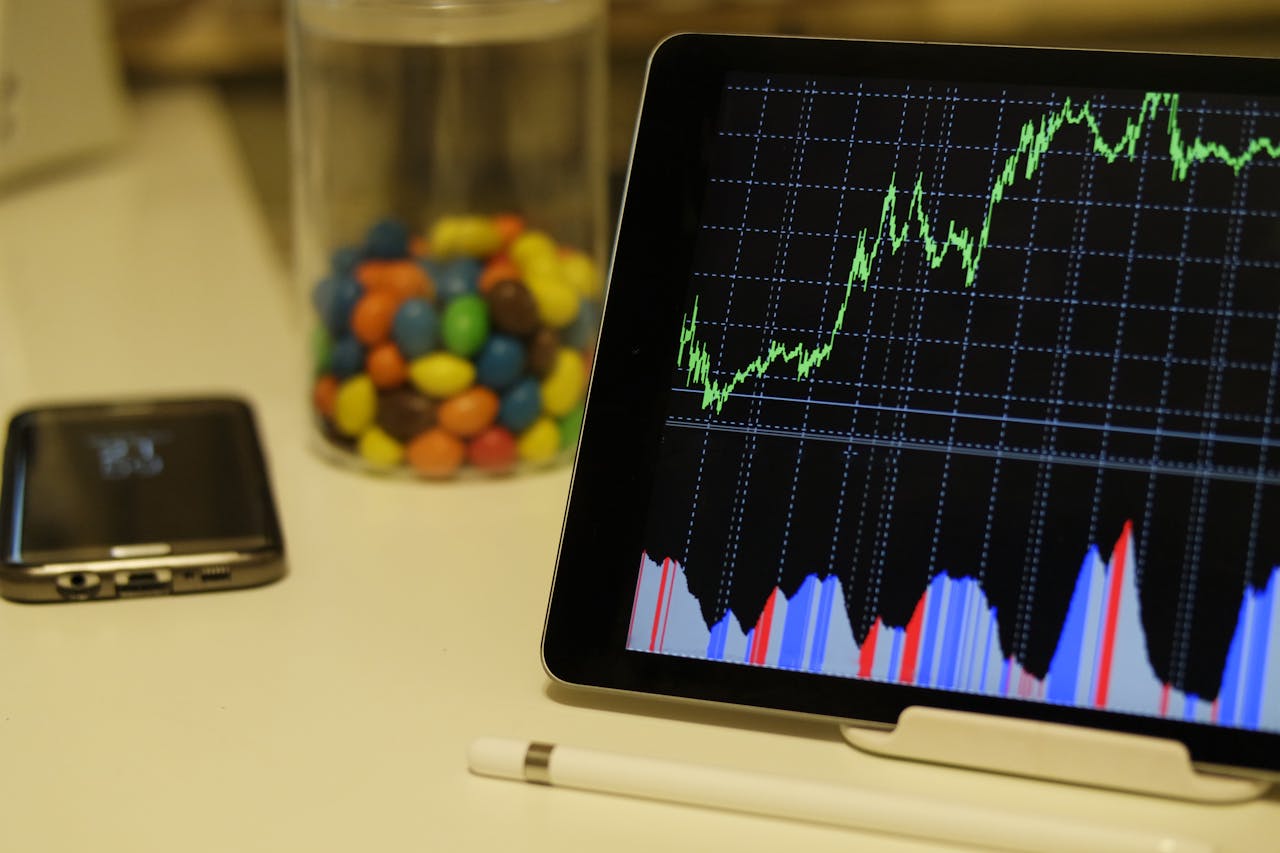
Swing traders combine technical analysis (chart patterns, indicators like RSI and moving averages) with fundamental analysis (project news, tokenomics, adoption trends) to identify entry and exit points. The goal is to find moments where price is likely to reverse direction within an established cycle, get in early, and get out before momentum fades.
Crypto’s around-the-clock volatility is a double-edged sword here. Large price swings within just a few days create frequent setups that stocks or forex pairs might take weeks to produce. But that same volatility can turn a winning trade into a loss just as fast, which makes risk management a core part of any swing trading approach.
How crypto swing trading works
A crypto swing trade follows a clear sequence from setup identification through exit. The typical trader places 1 to 5 trades per week, each built on the same general framework.
- Identify the dominant trend direction on a higher timeframe. Open the daily or weekly chart and determine whether the asset is trending up, trending down, or moving sideways. The higher timeframe sets the bias. Trading with the trend, not against it, improves the odds.
- Wait for a pullback to a key level. In an uptrend, you’re watching for price to dip back to a support level, a zone where buyers have stepped in before. In a downtrend, you’re looking for a bounce up toward resistance. Patience here separates swing trading from chasing price.
- Look for a reversal signal at that level. A bullish or bearish candlestick pattern (like a hammer or engulfing candle), divergence between an indicator and price, or a spike in volume can all confirm that the pullback is ending and the dominant trend is resuming.
- Enter the trade with a stop-loss order in place. For a long position, the stop goes below the support zone. For a short, it goes above resistance. The stop-loss defines your maximum loss on the trade before you even click “buy.”
- Set a profit target. This is usually the next resistance level (for longs) or support level (for shorts), or a predetermined risk-reward multiple. A minimum risk-reward ratio of 2:1 is widely recommended, meaning the potential profit should be at least twice the amount you’re risking.
- Monitor momentum indicators and price structure. You don’t need to stare at charts all day, but checking in once or twice daily lets you see whether the trade thesis still holds. Momentum indicators like RSI or MACD can warn you if the move is losing steam.
- Exit when the target is reached, the stop is hit, or the price structure shifts against the position. Discipline at exit matters as much as the entry. Holding past your target hoping for more, or widening your stop to avoid a loss, are habits that erode profitability over time.
Key strategies for crypto swing trading
Multiple proven strategies exist for timing swing trade entries, and the right one depends on current market conditions and your comfort level with chart reading. Each strategy uses different signals, but they all share one principle: enter near a high-probability turning point and exit before momentum fades.
Trend pullback trading
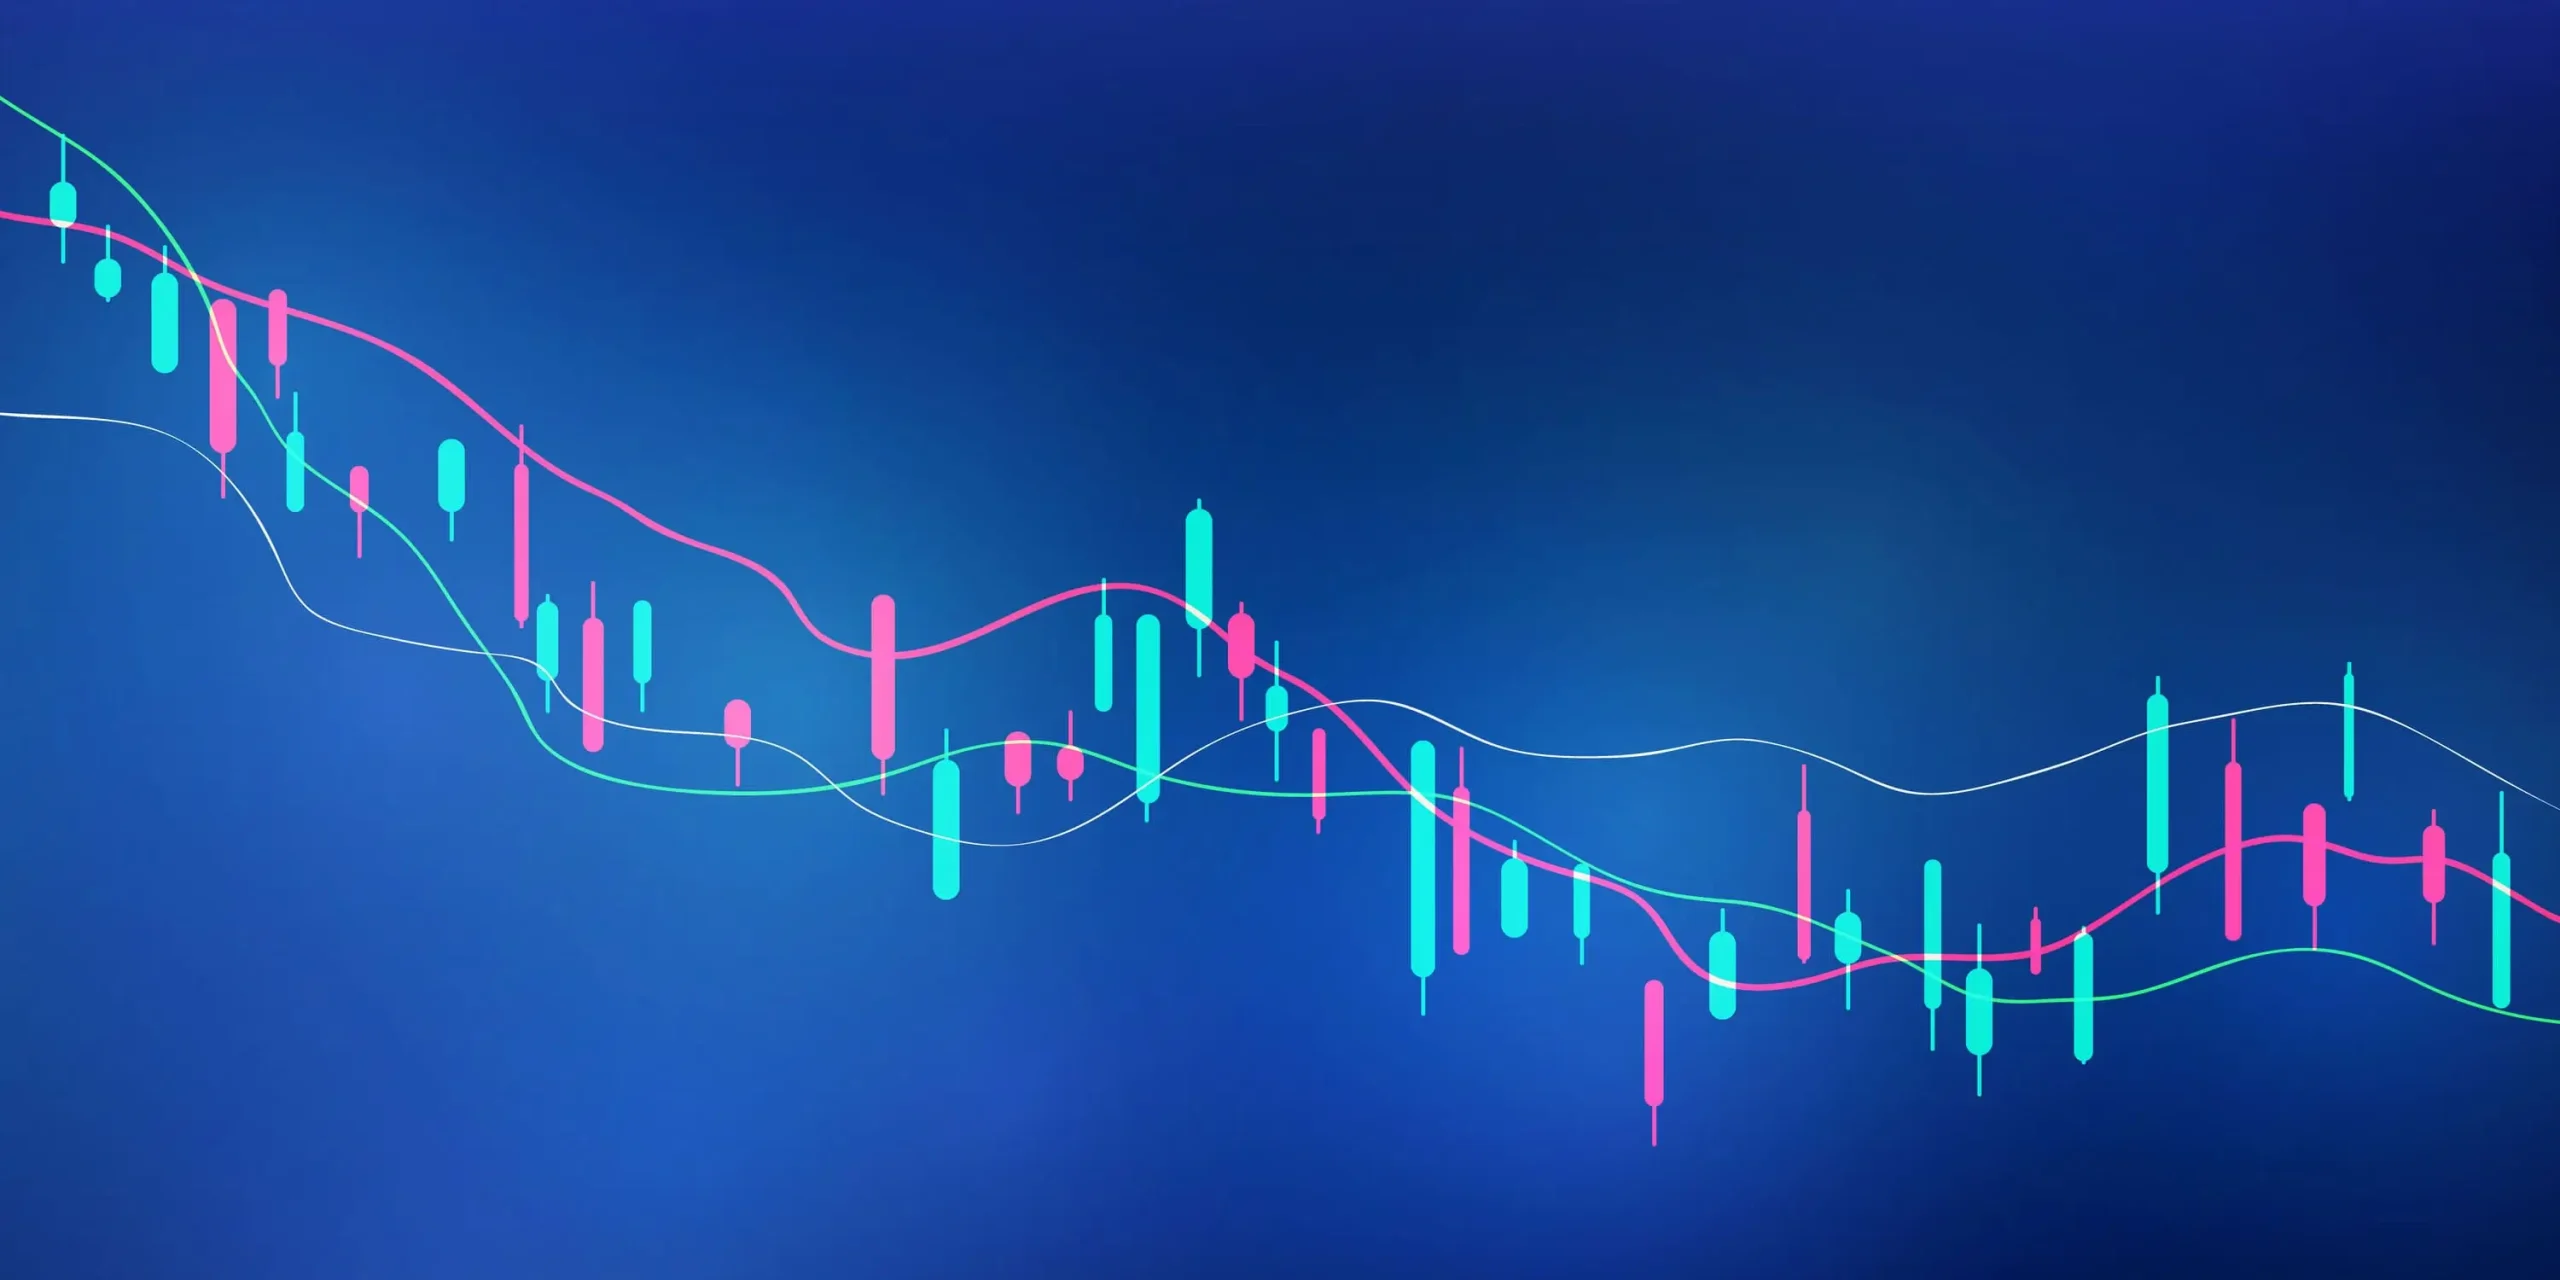
This strategy enters on a short-term pullback within a strong prevailing trend, catching the trade just as the dominant move resumes. Moving averages help gauge where that re-entry point might be.
Early in a trend, when momentum is strong and the move is fresh, price often bounces off the 8-day moving average. Dips to that level attract buyers quickly, and pullbacks tend to be shallow. As the trend matures and momentum naturally slows, pullbacks tend to go deeper, with the 20-day moving average becoming the more reliable bounce zone.
Trading volume confirms whether the trend has enough participation behind it. A pullback on declining volume followed by a bounce on rising volume suggests buyers are still in control. If volume stays flat or drops on the bounce, the trend may be losing conviction, and the pullback could turn into a reversal.
Breakout trading
A breakout trade triggers when price breaks above a resistance level or below a support level on increased volume. The idea is that once a well-established boundary gives way, price tends to move quickly in the direction of the break as new participants pile in.
The volume-weighted moving average (VWMA) is particularly useful here because it tracks the weight of money flowing into or out of the asset, not just the number of trades. A breakout accompanied by heavy VWMA participation carries more conviction than one on thin volume.
False breakouts are the main risk. Price pushes past a level, triggers entries, then reverses back inside the range, stopping out everyone who jumped in. Two things reduce this risk: waiting for a close beyond the level (not just a wick) and requiring above-average volume on the breakout candle. Both filters sacrifice some speed for a more reliable signal.
Moving average crossover
This strategy uses two moving averages of different periods, a faster one (such as the 50-day) and a slower one (such as the 100-day). When the shorter-term moving average crosses above the longer-term one, it signals a potential bullish trend. When it crosses below, it flags a bearish shift.
The tradeoff is lag. Because moving averages are calculated from past prices, crossover signals always trail the actual turning point. By the time the 50-day crosses above the 100-day, price has already been rising for a while. That lag means you’ll rarely catch the exact bottom, but it also means you’re entering a move that already has momentum behind it, which can reduce the frequency of whipsaws.
Combining crossover signals with other indicators, like RSI or volume, reduces false signals. A bullish crossover that lines up with RSI climbing out of oversold territory and rising volume carries more weight than a crossover happening in isolation.
Fibonacci retracement
After a large price move, traders expect a partial retracement before price resumes its original direction. Fibonacci retracement levels mark potential reversal zones within that pullback, giving you price targets where the correction might end.
The key Fibonacci retracement ratios are 23.6%, 38.2%, 50%, 61.8%, 100%, and 161.8%. In practice, the 38.2% and 61.8% levels get the most attention from crypto swing traders. A shallow pullback that holds at 38.2% suggests strong trend momentum. A deeper pullback to 61.8% still counts as healthy, but anything beyond that starts to question whether the original trend is intact.
Fibonacci levels work best when they align with other forms of support or resistance. If the 61.8% retracement of a Bitcoin rally lands right on a prior swing low or lines up with the 50-day moving average, that confluence gives the level more weight. A Fibonacci level sitting in empty space, with no other technical reason for price to react there, is weaker on its own.
Candlestick pattern trading
Candlestick formations provide visual cues about potential trend reversals or continuations by showing how buyers and sellers battled during a specific period.
Common reversal patterns include the Doji (a candle with a tiny body, showing indecision), the hammer (a small body with a long lower wick, suggesting buyers rejected lower prices), and engulfing candles (where one candle’s body completely covers the previous candle’s body, signaling a shift in control). These patterns are strongest when they appear at established support or resistance levels.
Continuation patterns like flags and pennants signal a brief pause within an ongoing trend before the next leg. Double tops and double bottoms mark areas where price tested a level twice before reversing, creating clear zones where the market has drawn a line. Head-and-shoulders formations signal exhaustion of the current trend, with the “head” representing a final push that fails to sustain above prior highs.
Technical indicators swing traders use
Technical indicators convert historical price and volume data into visual signals that guide entry, exit, and risk decisions. No single indicator works perfectly on its own, but each one adds a layer of information that helps you read what’s happening beneath the surface of price movement.
Relative strength index (RSI)
RSI is a momentum oscillator that measures the speed and magnitude of recent price changes on a scale from 0 to 100. A reading above 70 is generally interpreted as overbought, meaning price may have risen too fast and could pull back. A reading below 30 is considered oversold, suggesting the selling may be exhausted and a bounce could follow.
Divergence between RSI and price is one of the more reliable signals. If price is making higher highs but RSI is making lower highs, it suggests momentum is weakening even though price is still climbing. That bearish divergence can signal an upcoming reversal. The opposite, price making lower lows while RSI makes higher lows, flags bullish divergence.
These thresholds are common interpretations, not guarantees. In a strong uptrend, RSI can stay above 70 for extended periods without price dropping significantly. False signals occur, which is why most traders use RSI alongside other indicators rather than in isolation.
Moving averages (MA)
A moving average plots the average closing price over a set number of periods (such as 30, 50, or 200 days) to smooth out noise and reveal the underlying trend direction. Because it’s calculated from past prices, the MA line always lags the current market price.
That lag makes moving averages better at confirming an existing trend than predicting a new one. When price is consistently above its 50-day MA, the trend is up. When it’s below, the trend is down. Crossovers between a fast MA (like the 50-day) and a slow MA (like the 200-day) act as directional signals, with a bullish crossover sometimes called a “golden cross” and a bearish one a “death cross.”
Stochastic oscillator
The stochastic oscillator compares an asset’s latest closing price with its trading range over a default lookback period of 14 days. It’s scaled from 0 to 100, with readings above 80 suggesting overbought conditions and readings below 20 suggesting oversold conditions.
Two lines are plotted: the indicator line (%K) and the signal line (%D). Crossovers between them flag momentum shifts. When %K crosses above %D in oversold territory, it’s a potential buy signal. When %K crosses below %D in overbought territory, it’s a potential sell signal.
Like RSI, the stochastic oscillator can produce false or lagging signals. It’s not a standalone guarantee of price moves, and it works best when combined with trend analysis or other confirmation tools.
Support and resistance levels
Support is a price zone where buying pressure has historically prevented further decline. Resistance is where selling pressure has capped advances. These levels form the backbone of swing trade planning.
Swing traders set entries near support in uptrends and near resistance in downtrends, placing stops on the other side of the level. The logic is straightforward: if price has bounced from $25,000 three times in the past month, buyers are concentrated there. A fourth visit gives you a defined entry with a clear invalidation point (a break below that zone).
Levels are identified from previous swing highs, swing lows, and areas where trading volume was unusually heavy. A support level that held on high volume carries more weight than one that only caught price on a thin weekend session.
Swing trading vs. day trading vs. HODLing
Each approach suits a different schedule, risk tolerance, and goal. Here’s how they compare across the factors that matter most:
| Factor | Day trading | Swing trading | HODLing |
|---|---|---|---|
| Trade duration | Minutes to hours | A few days to a few weeks | Weeks to years |
| Analysis type | Heavily technical | Technical + fundamental | Primarily fundamental |
| Profit target per trade | Many small wins | Fewer trades, larger targets | Long-term appreciation |
| Screen time | Constant monitoring | Check-ins once or twice daily | Minimal daily attention |
| Overnight risk | None (positions closed daily) | Exposed to overnight and weekend moves | Rides out all volatility |
| Transaction costs | Higher (frequent trades) | Moderate | Low |
| Emotional demand | High (fast decisions) | Moderate | Low |
Swing trading suits people with full-time jobs or limited screen time. You don’t need to watch every tick, but you do need to review your positions daily. Day trading demands constant attention during active hours, which makes it hard to combine with other work. HODLing suits investors focused on long-term growth who are comfortable sitting through drawdowns without acting.
Risk management for crypto swing trades
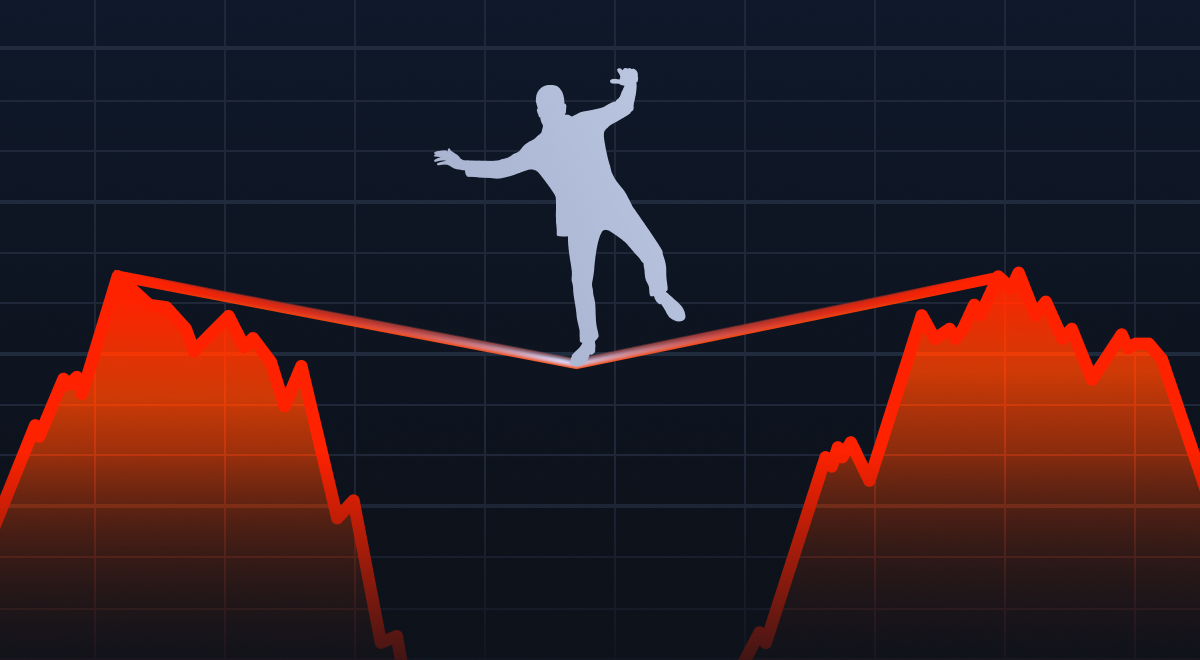
Crypto’s extreme volatility can turn a profitable position into a loss within minutes. That reality makes risk management the most important skill in swing trading, more important than finding the perfect entry.
The 2% rule and position sizing
Position sizing determines how much capital goes into a single trade. The most widely followed guideline is to risk no more than 1 to 2% of your total account balance on any single trade. On a $5,000 account, that means your maximum loss per trade is $50 to $100.
The math works like this: divide the dollar amount you’re willing to risk by the distance between your entry price and your stop-loss price. That gives you the position size. If you’re willing to risk $100 and your stop-loss is $2 below your entry, your position size is 50 units. If your stop is tighter at $1 below entry, you can take a larger position of 100 units while risking the same dollar amount.
This rule exists because even the best traders hit losing streaks. Risking 1 to 2% per trade means you’d need to lose many consecutive trades before your account takes serious damage, giving you room to recover. Risking 10% or more per trade means three or four losses in a row can cut your account nearly in half.
Stop-loss orders and exit plans
A stop-loss order automatically closes your position at a predetermined price, capping your loss before it grows. Without one, you’re relying on yourself to exit a losing trade, and that’s where emotion tends to take over.
The stop level can be set based on a fixed percentage below entry or, more commonly, at a technical level such as just below a support zone. Placing it at a technical level means the market has to break a meaningful boundary to stop you out, not just wiggle a percent or two.
Trailing stops add flexibility by moving the stop price higher as the trade moves in your favor. If you enter at $100 with a trailing stop of $5, and price climbs to $115, your stop automatically adjusts to $110, locking in $10 of profit while still giving the trade room to breathe.
The key discipline: both your profit target and your stop-loss should be defined before you enter the trade, not figured out on the fly.
Overnight and weekend wick risk in crypto
Crypto markets run 24/7 with no closing bell, no overnight halt, and no weekend break. Price can move sharply while you sleep. A position that looked safely above support at 10 PM can get stopped out by a 3 AM wick driven by news on the other side of the world.
This overnight and weekend risk is unique to crypto. In stocks, after-hours moves are limited by lower liquidity and tighter rules. In crypto, a Sunday evening can be just as volatile as a Tuesday afternoon.
Volatility-based buffers on your stops help account for wider intraday swings. Instead of placing your stop right below a support level, add a buffer based on the asset’s average true range (ATR), which measures how much the price typically moves in a given period. This wider stop reduces the chance that normal noise takes you out of a trade that’s still on track.
Borrowed-capital multipliers amplify this problem. A 5% overnight wick on a 10x leveraged position is a 50% loss. Keeping position multipliers conservative, or avoiding them entirely while learning, reduces the chance that a wick causes forced liquidation.
Diversification and risk-reward ratio
Spreading capital across multiple cryptocurrencies, sectors, or trade setups reduces your exposure to any single loss. If one trade goes against you, gains on other positions can offset the damage.
Evaluating whether the potential gain justifies the potential loss guides which trades are worth taking. A minimum 2:1 ratio means the potential gain is at least twice the potential loss. For example, if you’re risking $1 per unit on a trade, you should have a reasonable expectation of earning at least $2 to $3.
This ratio matters because no trader wins every trade. At a 2:1 risk-reward ratio, you can be wrong on half your trades and still break even. At 3:1, you can be wrong on more than half and still come out ahead. Only taking trades with a favorable ratio keeps overall profitability positive even through inevitable losing streaks.
Choosing cryptocurrencies for swing trading
Not every cryptocurrency works well for swing trading. The right picks share a few characteristics.
High liquidity means large daily trading volume, which lets you enter and exit positions at the prices you want with minimal slippage. Thinly traded coins can show wide gaps between the bid and ask price, eating into your profits or making it hard to exit a losing position quickly.
High volatility creates the directional moves swing traders need. An asset that barely moves 1% per week doesn’t generate enough range to produce a worthwhile swing trade after accounting for fees.
Strong market capitalization reduces exposure to manipulation by large holders (whales). A crypto whale dumping a significant portion of a low-cap token’s supply can crash the price in minutes, blowing past your stop before the order even executes.
Established network and active development provide fundamental backing that lowers the chance of an abrupt collapse. Projects with real usage, an active developer community, and a clear roadmap are less likely to go to zero overnight.
Bitcoin (BTC) carries the highest liquidity and market cap in crypto and frequently exhibits multi-day swings that fit the swing trading timeframe. Ethereum (ETH), the second-largest by market cap, sees demand driven by DeFi and smart contract activity, creating volatility around network upgrades and growth in its broader network.
Be cautious with low-cap altcoins. Pump-and-dump schemes and coordinated manipulation are common in that space and can wipe out swing positions before you have time to react. Monitor tokenomics, upcoming protocol upgrades, and regulatory developments as fundamental catalysts that can drive the next swing.
Tools and platforms crypto swing traders use
Swing trading doesn’t require expensive software, but the right tools save time and reduce mistakes.
Charting platforms display price movement over time, and candlestick charts are the preferred format for any complex analysis because they show open, high, low, and close data in a single visual. TradingView is the most widely used charting tool in crypto, offering a full library of indicators, drawing tools, and price alerts across thousands of crypto pairs.
Technical indicator overlays like RSI, MACD, Bollinger Bands, and moving averages are applied directly on charts to spot patterns and signals without switching screens. Most charting platforms let you layer multiple indicators and save custom layouts.
Market data aggregators compile tokenomics, market cap, trading volume, and news in one view, which is helpful for screening coins and tracking fundamental developments that could trigger a swing.
Risk calculators handle position sizing and risk-reward math before you enter a trade. Plugging in your account size, risk percentage, entry price, and stop-loss price gives you the exact number of units to buy or sell.
Trading bots automate trade execution based on predefined rules and technical signals. They remove emotional interference from the process, executing entries and exits at the parameters you set, even at 3 AM.
Alerts and conditional orders let you step away from the screen while the market runs around the clock. You can set price alerts to notify you when a coin reaches a level you’re watching, or place conditional orders that execute automatically when specific conditions are met.
Can you swing trade crypto with $100?
Yes. Swing trading doesn’t require large capital to get started, and $100 is enough to begin learning and practicing the mechanics.
Under the 1 to 2% risk rule, a $100 account means risking $1 to $2 per trade. That limits your position sizes significantly, and gains accumulate slowly. A 10% winning trade on a $20 position nets $2. Compounding helps over time, but realistic expectations matter: you won’t turn $100 into $10,000 in a month.
Fractional trading on most crypto exchanges means you don’t need to buy a whole Bitcoin or a whole Ether. You can buy $15 or $50 worth of any supported coin, which keeps even a $100 account flexible enough to practice different setups.
The real cost to watch at this level is fees and spreads. Trading fees that feel negligible on a $5,000 position consume a larger percentage of returns on a $20 position. If an exchange charges 0.1% per trade and you’re targeting a 5% move, the round-trip cost of 0.2% barely dents a large trade but represents a meaningful slice of a small one.
The value of starting with $100 isn’t the dollar return. It’s building discipline, developing the habit of following a plan, and learning how it feels to hold a position through volatility, all with money you can afford to lose. Once you’re consistently following your rules and seeing how your strategy performs over dozens of trades, scaling up with more capital carries far less risk of the emotional mistakes that blow up larger accounts.
Pros and cons of swing trading crypto
Swing trading has clear advantages over other approaches, but it comes with real drawbacks that you should weigh before committing capital.
Advantages:
- Lower time commitment than day trading. Positions develop over days, not minutes. You can review charts in the morning and evening without needing to sit in front of a screen during market hours.
- Captures larger price moves per trade. Each trade targets a bigger percentage gain than scalping or day trading, which means fewer trades are needed to reach the same profit in dollar terms.
- Relies primarily on technical analysis. Once you’ve learned to read charts and indicators, the decision process becomes more systematic and less dependent on chasing news.
- No pattern day trader (PDT) rule in crypto. In U.S. equities, the PDT rule restricts accounts under $25,000 from making more than three day trades in five business days. This rule doesn’t apply to cryptocurrency trading.
- Workable with a full-time job. You don’t need to quit your day job to swing trade. The slower pace fits around most work schedules.
Drawbacks:
- Overnight and weekend exposure. Crypto’s 24/7 market means wicks and gaps can hit at any hour. A position that looked solid before bed can be underwater by morning.
- Abrupt reversals from external events. News, regulatory announcements, or whale activity can cause sudden, large moves against your position, sometimes faster than a stop-loss can execute at your intended price.
- Opportunity cost. Capital committed to an open swing position is unavailable for other setups that appear during the holding period and misses any passive appreciation it might earn if simply held long term.
- Requires proficiency in chart reading. You need to understand candlestick patterns, indicators, and support and resistance before you can reliably identify swing trade setups. Mastery takes time and practice.
- Emotional discipline is non-negotiable. Following stop-losses when they’re hit, not doubling down after a loss, and walking away after a losing streak are all harder in practice than they sound.
Is swing trading crypto right for beginners?
Swing trading carries significant risk and works best for traders who have at least a basic understanding of technical and fundamental analysis. It’s not a way to passively earn money without effort or knowledge.
That said, swing trading’s slower pace compared to day trading gives you more time to analyze setups, make decisions, and learn from mistakes without the pressure of split-second execution. That buffer makes it more approachable for newer traders than styles that demand instant reactions.
Before committing real money, paper trading or demo accounts let you practice the full cycle, from identifying a setup to entering, managing, and exiting a trade, without financial risk. Many exchanges and platforms offer this.
Keeping a trade journal accelerates learning. Recording every setup, entry, exit, and outcome forces you to review your decisions objectively. Over time, patterns in your own behavior become visible: maybe you consistently enter too early, or you tend to move your stop-loss when you shouldn’t. Those patterns are hard to see without a written record.
Starting with higher-liquidity assets like BTC and ETH reduces manipulation risk while you’re still learning. Low-cap coins can teach expensive lessons through sudden pumps and dumps that have nothing to do with your analysis.
Clear, written rules for entry, exit, and position sizing protect beginners from impulsive decisions. When the plan is defined before the trade, there’s less room for emotion to override logic.
Frequently asked questions about crypto swing trading
How much capital would I need to make $1,000 a month swing trading?
There’s no fixed number that guarantees a monthly income from swing trading. The answer depends on your account size, win rate, average gain per trade, and how much you risk per trade. A larger account and a consistent edge increase the probability of hitting that target, but losses can occur in any month. Treating swing trading as a guaranteed income source leads to overtrading and excessive risk-taking.
What is the downside of swing trading?
The main downsides are overnight risk (prices can move sharply while you’re away from the screen), abrupt market reversals from unexpected news or whale activity, emotional stress from holding through drawdowns, and the opportunity cost of capital tied up in open positions. Each of these can be managed but not eliminated.
How does crypto market volatility create opportunities for swing traders?
Cryptocurrencies produce larger and more frequent price swings compared to traditional markets like stocks or forex. That wider range of movement creates more setups per week for swing traders to act on. However, the same volatility that creates opportunity also increases the risk of stop-outs and rapid reversals. Higher volatility means wider stops, larger potential losses per trade, and a faster-moving market that can shift direction without warning.
Building a repeatable swing trading routine
Consistent results come from a structured routine, not from taking random trades whenever something catches your eye.
Start each day or week with a review of higher-timeframe charts, the daily and weekly, to identify which assets are trending and which are range-bound. This sets your bias. You’re not looking for trades yet; you’re establishing which direction each market is leaning.
From that review, build a watchlist of liquid, volatile coins filtered by volume and recent price action. AXL Research Hub maintains guides on evaluating exchanges and tracking tools that can speed up this screening process. Five to ten coins that meet your criteria are enough to give you plenty of setups without overwhelming your attention.
Before entering any trade, run through a pre-trade checklist: Is the trend direction confirmed on a higher timeframe? Has price pulled back to support (for longs) or resistance (for shorts)? Is there a reversal signal present, such as a candlestick pattern or indicator divergence? Are your stop-loss and target defined? Is the position sized within your risk limits? If any answer is no, the trade isn’t ready.
After each trade closes, log the outcome. Compare your actual execution to the plan. Note what worked and what didn’t. This post-trade review is where improvement happens. Without it, you’ll repeat the same mistakes without realizing it.
Set emotional rules and follow them. Don’t trade after a loss streak. Step away when frustration starts driving decisions. And never move a stop-loss further from your entry to avoid taking a loss. Moving a stop turns a small, planned loss into an uncontrolled one.