
The short answer to “what is tokenomics” is this: it’s the economic design of a crypto token, covering how many tokens exist, who holds them, when new ones unlock, and what anyone actually needs them for. Those rules shape dilution, sell pressure, and long-term demand, so reading them tells you more about a token’s staying power than its price chart does.
What is tokenomics?
Tokenomics, a blend of “token” and “economics,” is the economic design of a cryptocurrency or blockchain token. It covers how the token is created, distributed, used, and managed inside its ecosystem. In practice, it’s the rulebook connecting a token’s supply and utility to how holders behave and how the protocol grows.
Think of it as on-chain monetary policy. A traditional company answers to a corporate board and to regulators, and its share policy can change at a shareholder meeting. A crypto project is governed largely by code, so rules like how many tokens get minted, who receives them, and when they can be sold are written into smart contracts and play out automatically. Those rules decide how value moves through the ecosystem.
The company comparison makes this concrete. A stock’s share count, dividend policy, and buyback plan have rough counterparts in a token’s supply, its rewards, and its burns.
Not every design holds up. Good tokenomics ties supply and demand to real usage, so people need the token because they’re doing something with it. Bad tokenomics leans on a narrative, and once the scarcity story or the reward program fades, nothing is left holding demand up.
What is a token in cryptocurrency?
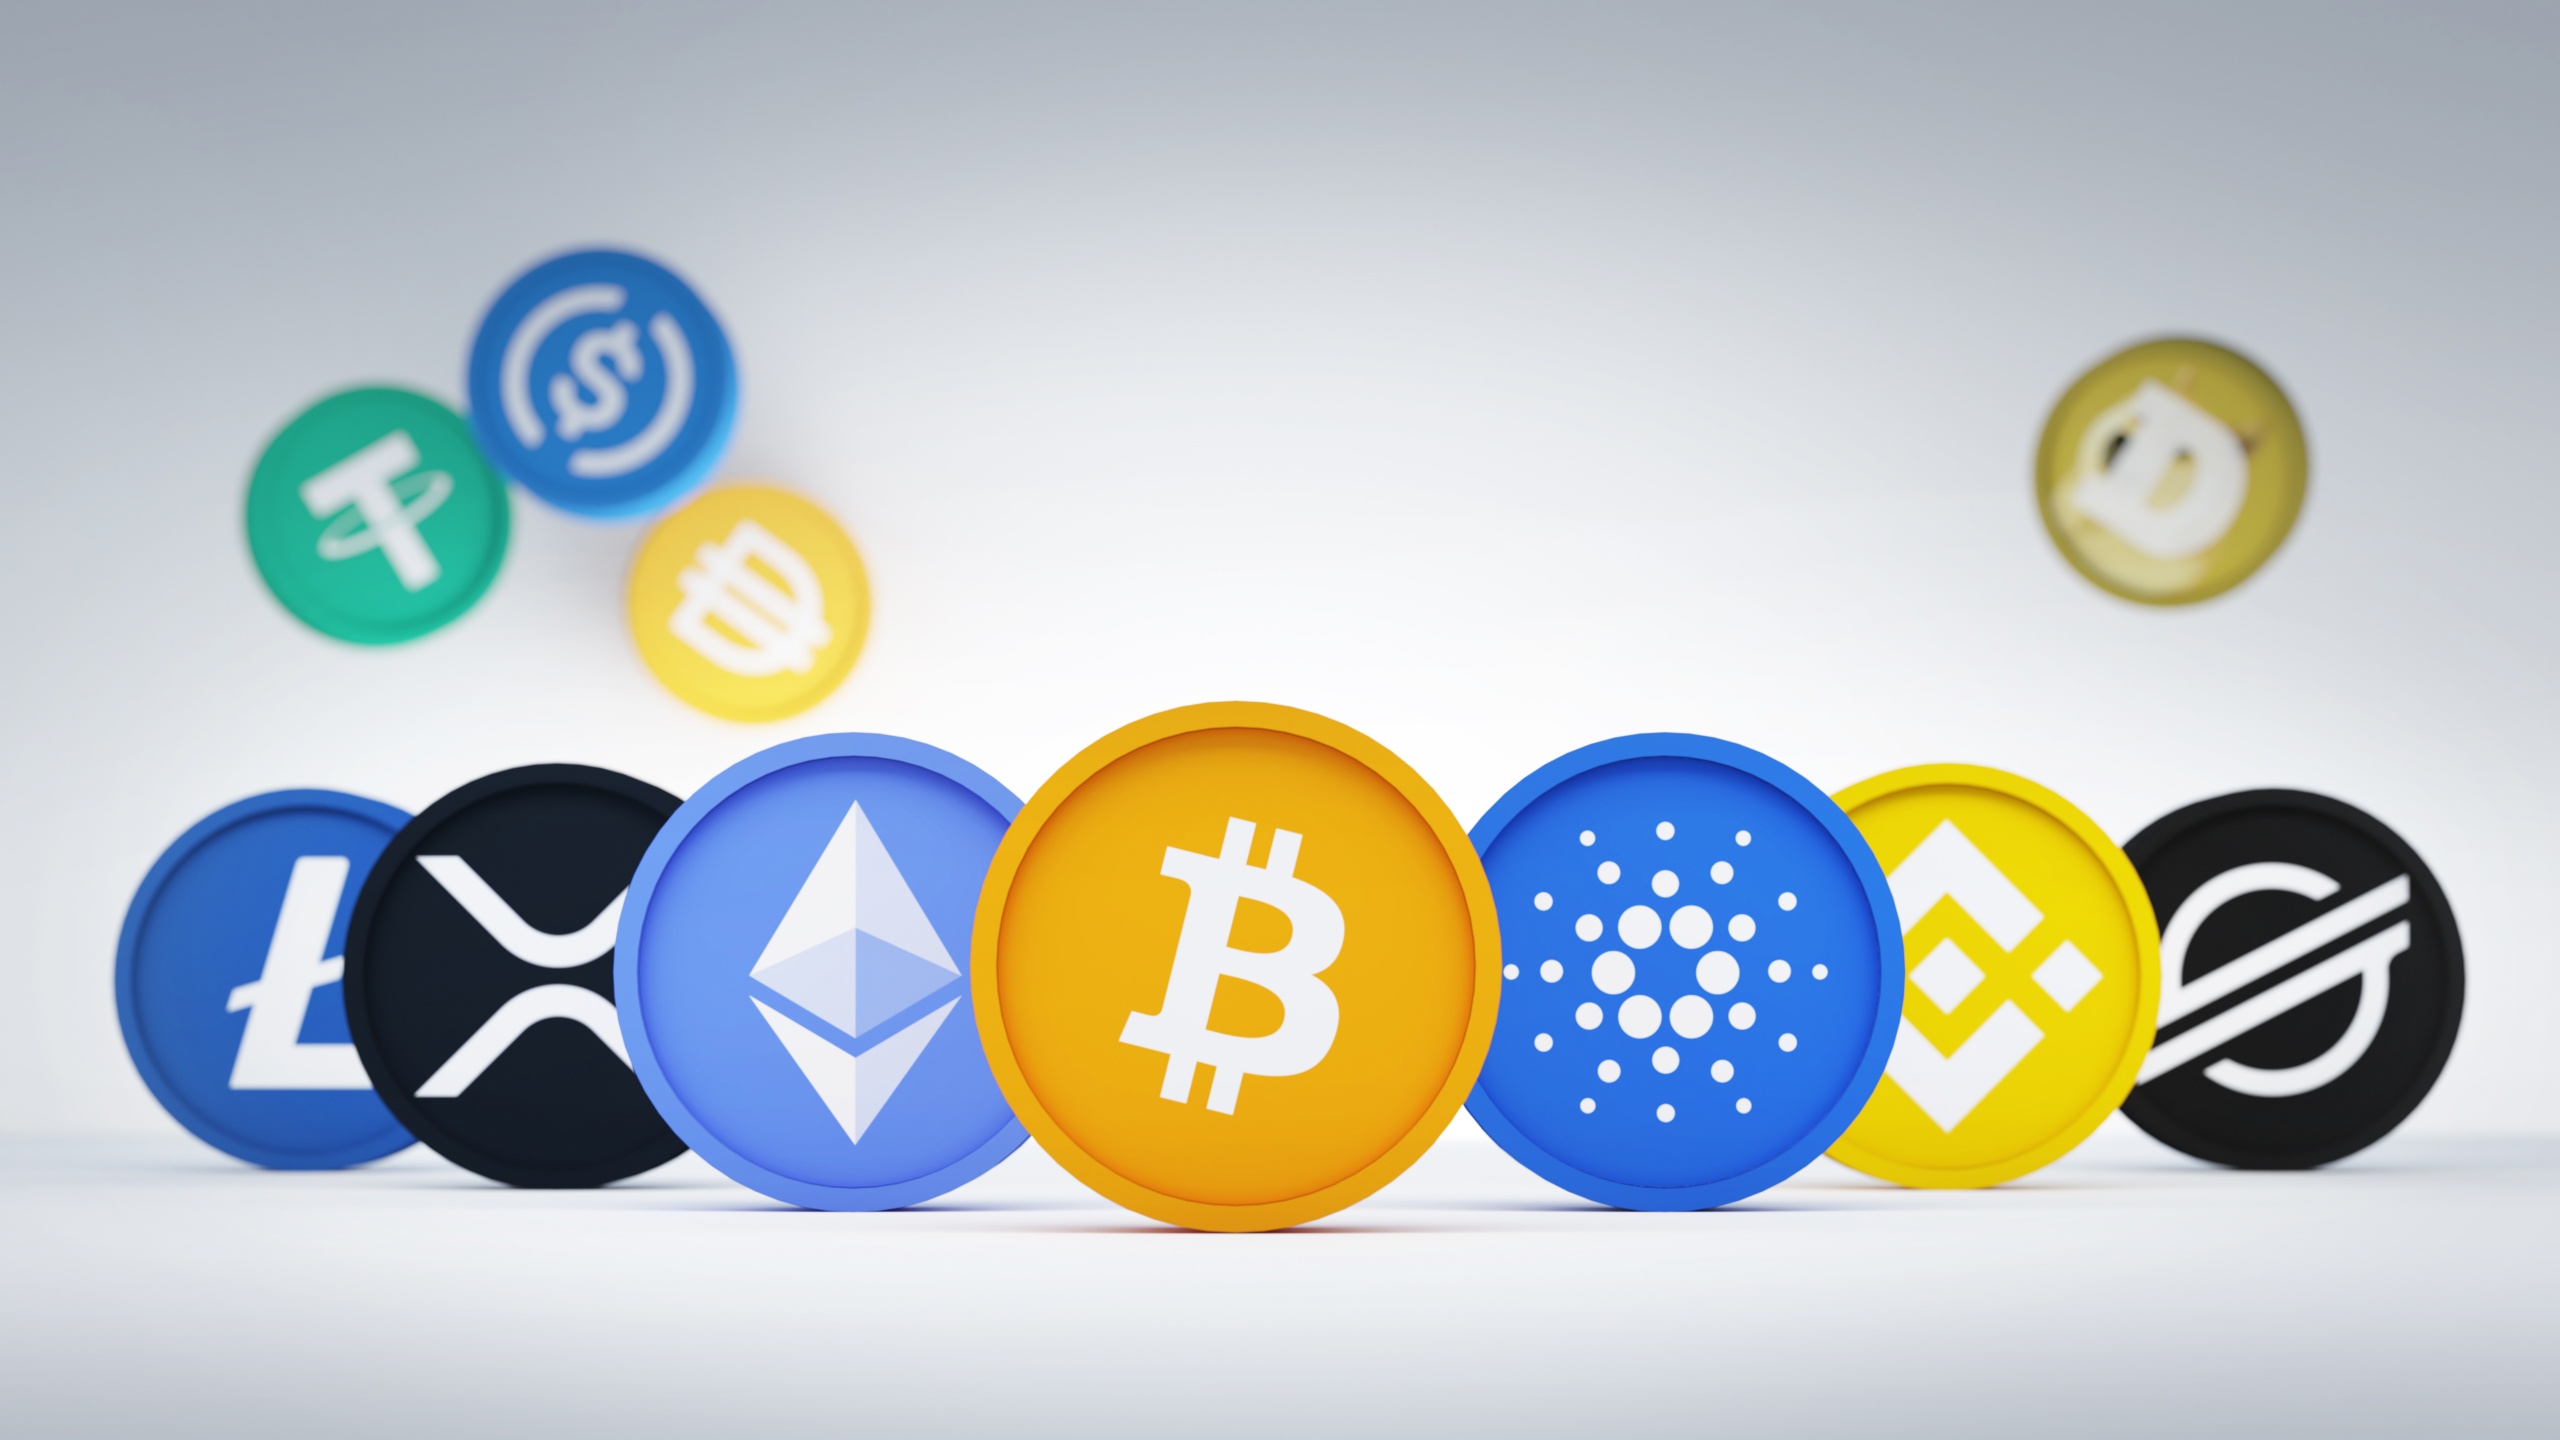
A token is a crypto asset issued through smart contracts on a host blockchain, usually representing a specific utility or asset inside a project. A coin is the native asset of its own blockchain. Bitcoin (BTC) is a coin on the Bitcoin blockchain, while UNI, LINK, and USDT are tokens that run on Ethereum.
The distinction tells you where an asset lives and what it depends on, but coins and tokens both carry token economics: rules for supply, distribution, and utility. When people talk about tokenomics, they mean both.
Why tokenomics matters for a token’s value
A token’s price comes down to supply and demand mechanics, not sentiment alone. How much of the supply is circulating, how fast new tokens are emitted, and when locked tokens unlock all shape how volatile a token is and how much sell pressure it faces.
That’s why two tokens with the same crypto market cap today can end up in very different places. Picture one with a hard cap, active utility, and broad distribution next to one with constant emissions and a supply mostly held by insiders. Holders of the first token aren’t being diluted and people actually use it, while the second keeps adding supply that insiders can sell into. Market cap shows where both stand now; tokenomics shows where the pressure will build later.
Over the long run, a token builds value when steady demand for its utility meets controlled dilution. When supply grows faster than anyone needs the token, oversupply tends to crush performance regardless of the marketing. A good sustainability test is whether the ecosystem can fund development, security, and community rewards without constant inflationary handouts. If every one of those costs is paid by minting new tokens, holders are footing the bill through dilution.
Well-designed projects aim for a flywheel: utility attracts users, users raise demand for the token, demand lifts its value, and a higher value draws more developers and users, feeding the loop again. The same flywheel can spin in reverse, which is why the inputs deserve more of your attention than the pitch.
Key components of tokenomics
Most tokenomics models rest on three core pillars: supply, distribution, and utility. Incentives, governance, and vesting complete the picture.
These parts work as one system, so you can be misled if you grade them one at a time. A hard cap or strong utility can be undercut by a single weak spot, such as an allocation that hands most of the supply to insiders. When you review a project, find the weakest component first, because that’s where the design is most likely to give way.
Circulating vs total vs max supply
You’ll see total supply defined differently from one site to the next, which is why the same token can show conflicting numbers. Here’s the breakdown we use, and it keeps the three figures from overlapping:
- Circulating supply is the number of tokens available and tradable in the market right now.
- Total supply is every token issued so far minus any that have been burned. It includes tokens that are locked, reserved, or not yet released, so it’s usually larger than circulating supply.
- Max supply is the absolute hard cap on how many tokens can ever exist, when a project sets one. Some projects don’t, and that’s a design choice you should notice.
Circulating supply changes over time as new tokens are minted or released from vesting, and that’s where price risk hides. A low circulating supply at launch makes the token look scarce and can push the price up. If total or max supply is much larger and scheduled releases come quickly, the price is exposed to dilution as those tokens arrive.
Supply rules also spell out how new tokens get minted, and the pace matters as much as the cap. A project with a max supply can still flood the market if it mints toward that ceiling fast.
Token distribution and allocation
Distribution describes how the supply splits among the groups involved in a project, and the percentages next to each label tell you who holds power once trading starts. Most allocation charts include some mix of these buckets:
- Team, founders, and advisors, who receive tokens for building and guiding the project.
- Early investors, meaning venture capital firms and angel investors, whose tokens usually sit under vesting schedules.
- Presale and public sale allocations for early buyers and public participants.
- Treasury and ecosystem funds that pay for future development, grants, partnerships, and marketing.
- Community allocations and airdrops that reward early participation and help build a user base.
- Staking and reward pools set aside for users who secure or support the network.
A high percentage for the team and other insiders signals concentrated power and centralization risk, since a small group can move the price or steer decisions. Whenever a few holders own a large share of the supply, those whales can dominate liquidity, price, and governance votes. Broad, transparent distribution works the other way: it supports decentralization and makes it harder for any single entity to take control.
Vesting schedules and token unlocks
A vesting schedule is the timetable for when allocated tokens become accessible, and sellable, for the team, investors, and partners. “Tokens unlock over time” hides the details that actually move prices, so the mechanics are worth knowing.
A cliff is an initial lock period followed by a large first unlock. Nothing reaches the market during the lock, then a big block arrives at once. Linear vesting usually takes over after the cliff, releasing tokens at a steady pace.
Dynamic vesting ties releases to project milestones instead of the calendar, so insiders get tokens as the project hits defined goals. A simple calendar-based example is team tokens unlocking monthly over two years. Terms vary widely between projects, so read the specific schedule instead of assuming one.
Lock-up periods exist to limit sudden dumps by early insiders before the product matures. Without them, the people who got tokens cheapest could sell before real users ever show up.
The catch is that unlocks follow the calendar, not the product. In an unlock-heavy month, circulating supply can jump fast, and if recipients sell, the price can sink even while the product keeps improving. Check the unlock calendar before you buy and know when the next big cliff lands. On the positive side, a transparent, published vesting schedule signals that the team plans to stick around.
Token utility
Utility is what a holder can actually do with a token, and it’s the main source of real demand. The common uses fall into a few groups:
- Payments: covering network fees and transaction fees, or buying goods and services.
- Governance: voting on protocol proposals and changes.
- Staking and security: locking tokens to help secure a Proof-of-Stake network and earning new tokens in return.
- Collateral: posting the token as collateral inside DeFi applications.
- Access: unlocking premium features, tiers, or services through token-gating.
Recurring use creates stronger demand than one-time novelty. A token you need every time you pay a fee, stake, borrow, or vote gets bought again and again; a token used once for a launch gimmick doesn’t. A token with no purpose at all amounts to a digital collectible, priced on attention alone.

Using a token and controlling a protocol are separate roles. A utility token’s job is what you do with it, while a governance token gives you a say in how the protocol runs. Some tokens combine both, and some carry traits of security tokens, which can bring different legal treatment and investor rights.
Staking, yield farming, and incentives
Incentives reward people for staking, holding, providing liquidity, and contributing to the network. Validators, liquidity providers, and developers are the main groups on the receiving end.
Staking and yield farming lock tokens up, which shrinks circulating supply and encourages long-term commitment, but the question to ask is where the rewards come from. Yield farming, liquidity mining, and eye-catching APYs are often funded purely by new token emissions, so the source makes all the difference: APY paid from protocol revenue means users are sharing real income, while APY paid in freshly minted tokens means the protocol is printing the reward.
When staking rewards come from heavy dilution, holders end up funding their own inflation. Your token count goes up, but so does everyone else’s, and each token represents a smaller share of the network. These programs also attract mercenary capital: users who arrive for the rewards and leave as soon as the rewards drop, often selling what they earned on the way out.
For networks secured by crypto staking, the damage from heavy dilution reaches beyond holders’ portfolios. Security depends on the value of staked tokens, so as token value collapses, the economic barrier protecting the network weakens with it.
Token governance
Governance tokens give holders a vote on protocol upgrades, fee structures, and treasury spending. The tokenomics sets the details, including how much voting power each token carries, what quorum a vote needs, and how proposals get made.
Different setups spread power in different ways. DAO voting and on-chain governance let token holders decide directly. Delegation lets you hand your votes to someone else who follows proposals closely. Quadratic voting makes each extra vote cost more, so influence grows more slowly than holdings and big wallets don’t automatically win.
Many projects are less decentralized than their governance page suggests. A core team, a multisig wallet, or admin keys may still be able to change key parameters, and upgradeable contracts allow rules to change after launch. Even in open systems, two weaknesses persist: governance capture by large holders, who can vote through proposals that drain the treasury or alter smart contract code, and voter apathy, where so few people vote that a small, motivated group decides outcomes.
Inflationary vs deflationary tokenomics
The issuance schedule, meaning how new tokens get created through mining, staking rewards, or protocol incentives, is the main source of inflationary pressure. Inflationary models use that issuance to reward validators and fund growth, and they stay sustainable only when demand grows faster than dilution. Deflationary models go the other way, cutting net supply through burns, fixed caps, or shrinking emissions.
| Supply model | How it works | Best fit | Main risk |
|---|---|---|---|
| Fixed supply | Max supply cannot increase | Store-of-value assets and capped ecosystems | Demand fails to grow fast enough |
| Inflationary supply | New tokens issued on an ongoing basis | Networks paying ongoing validator or user rewards | Supply outpaces demand |
| Deflationary supply | Tokens burned or removed from circulation | Fee-generating platforms with strong utility | Burns turn cosmetic when usage and fees are weak |
| Emission-based rewards | Tokens distributed as incentives | Early-stage networks and liquidity bootstrapping | Mercenary capital leaves quickly |
| Governance-adjusted supply | Community changes emissions or policy | Mature protocols needing flexibility | Poor governance dilutes holders |
Neither model is better by default. Scarcity without demand turns into illiquidity, not value: a capped token nobody needs just trades thinly. Burns and token sinks offset dilution only when they outpace emissions, and on a platform with weak usage and few fees, burns are mostly cosmetic.
The right fit depends on the project’s stage and business model. An early network may need emissions to attract validators and liquidity, while a mature platform that earns real fees can lean on burns and tighter supply.
Tokenomics metrics: market cap, FDV, and more
A handful of numbers do most of the work when you size up a token’s supply picture, and the gap between market cap and FDV is often the most revealing of them.
- Market capitalization is circulating supply multiplied by current price. It’s a snapshot of the token’s current size and ignores tokens still waiting to unlock.
- Fully diluted valuation (FDV) is what the market cap would be if every token were already circulating.
- The FDV and market cap gap matters because a wide one points to future dilution: locked tokens will enter circulation, and the market has to absorb them.
- Inflation rate tells you how fast new tokens are entering circulation.
- Burn rate tells you how fast tokens are leaving the supply; set it against the inflation rate to see which way net supply is moving.
- Circulating supply growth, tracked over time, catches surprise dilution that a single snapshot would miss.
- Staking participation shows the share of supply locked in staking, which is supply that can’t be sold instantly while it stays locked.
- Unlock timelines show when vested tokens will hit the market, so you can see sell pressure coming before it arrives.
Tokenomics examples
Every blockchain project designs its tokenomics differently, and its choices on supply, burns, and rewards shape how attractive and sustainable it becomes. Four well-known designs show the range.
Bitcoin (BTC)
Bitcoin has a max supply of 21 million BTC. New coins enter circulation as crypto mining rewards, and those rewards are cut in half on a set schedule, every four years. Each halving reduces new coin issuance, so supply grows more and more slowly as it approaches the cap.
The hard cap plus the halving schedule is engineered scarcity, designed with long-run price appreciation in mind. Whether that plays out depends on demand, since the design only controls the supply side.
Ethereum (ETH)
ETH has no fixed supply cap. Its main role is powering the Ethereum ecosystem: users pay gas fees in ETH for transactions and smart contract execution, and gas pricing responds to market demand, climbing when the network is busy.
Ethereum runs on Proof of Stake (PoS), with validators securing the network and receiving newly issued ETH. The EIP-1559 upgrade added fee burning, which destroys part of the fees users pay. Those burns offset new issuance and give the network a way to manage supply, with the balance between issuance and burns depending on how heavily the network is used.
BNB
BNB (Binance Coin) relies on regular token burns that permanently remove coins from circulation, with the aim of keeping supply shrinking. The approach works much like a stock buyback in traditional markets: fewer units outstanding, so each remaining unit represents a larger share. As with buybacks, a burn reduces supply without guaranteeing a higher price, because demand still has to show up.
Axie Infinity (AXS and SLP)
Axie Infinity uses a dual-token system. AXS is the governance token, and SLP is the in-game utility token, with rewards designed to encourage gameplay and participation in the ecosystem.
The weak point is the utility token. When it inflates through rewards and the game lacks strong token sinks (ways for players to spend and remove tokens), players earn far more than they spend, sell the excess, and the sell pressure snowballs.
Common tokenomics red flags
You can catch tokenomics red flags before buying anything, because they appear in a project’s docs and on-chain data. These are the warning signs we’d treat as reasons to slow down and dig deeper:
- Very high FDV next to a small market cap, plus near-term unlocks: a large chunk of supply is about to hit the market, adding dilution and sell pressure at the same time.
- Uncapped emissions without proven demand: new tokens keep arriving whether or not anyone needs them, which leads to chronic oversupply.
- Aggressive allocation to team, advisors, and investors, especially with a short vesting cliff: insiders can sell large amounts early, before the product has a chance to prove itself.
- “Ponzi APY”: staking rewards paid mainly from emissions only hold up while new buyers keep absorbing the freshly minted tokens.
- Circular utility: if you need the token only to earn more of the token, the loop collapses when liquidity dries up.
- A few whales controlling the DAO, or upgrades that can change supply rules overnight: the rules you bought into can be rewritten without your consent.
- Thin liquidity and concentrated holdings: a few wallets can move the price, which invites manipulation.
- Opaque allocation or no published unlock calendar: if you can’t see who holds what and when it unlocks, you can’t judge dilution risk.
- Unrealistic reward promises or poorly explained reward mechanics: when nobody can explain where the yield comes from, it’s likely coming from new tokens or new buyers.
One red flag on its own doesn’t prove a project is a scam. Several together should make you very cautious, especially when they involve supply and insider control at the same time.
How to analyze tokenomics before investing
A structured check keeps you from judging a token by its chart. Work through these steps in order, since the early ones can rule a project out before you need the rest.
- Read the token’s purpose first. Go to the whitepaper or docs before you look at the price chart. If you can’t explain the token’s role in one sentence, the design is likely vague or driven by marketing.
- Check the supply schedule. Look at circulating supply, max supply, team vesting, investor cliffs, and scheduled emissions, and review the issuance schedule for the next 12 to 36 months. A cheap-looking chart can hide heavy future dilution.
- Test whether utility creates repeat demand. Fees, staking, collateral, voting, and access bring people back to the token again and again. One-off uses don’t.
- Measure value capture. Ask who benefits when the protocol earns money. Holders should get something real, such as a share of fees or meaningful governance power, instead of value flowing mainly to the team, market makers, or outside service providers.
- Inspect governance and admin rights. Find out whether the contracts are upgradeable, who controls the multisig, and how much power the community has over key parameters.
- Review smart contract audit reports. Audits verify token security and can catch flaws in the code that enforces the tokenomics. An audit lowers risk; it doesn’t remove it.
- Compare against similar projects. Line up emission rates, fee capture, governance breadth, and user demand against peers, not just the token’s own history.
- Weigh outside factors. Macroeconomic conditions, regulatory trends, and technology shifts can override good design. Round this out with market demand signals: historical price, trading volume, liquidity, and community engagement.
Step 4 is where a popular protocol and a good token can part ways. A protocol can have heavy usage and growing revenue while its token sits idle, because fees go to a company, a foundation, or service providers and the token carries little more than a symbolic vote. When you read the docs, trace where user fees actually end up. If the path never touches token holders, strong usage won’t necessarily show up in the token.
Public, open-source blockchains let anyone verify a project’s stated tokenomics, so you don’t have to take a team’s word for it. A block explorer like Etherscan shows a token’s total supply, circulating supply, and top holders. Use the official contract address from the project’s docs, because copycat tokens can share the same name and ticker. Some big addresses belong to exchanges, staking contracts, or vesting contracts rather than individuals, so check the address labels before drawing conclusions.
Tokenomics FAQ
Why can well-planned tokenomics still fail?
Every token model is built on assumptions about user behavior and market conditions. When regulation shifts, competitors arrive, or adoption stalls, those assumptions can break, and a design that looked balanced on paper ends up with too much supply or too little demand.
How can you learn tokenomics?
Start with the token economics sections of real whitepapers. Research and frameworks from a16z Crypto and CoinGecko Research give you structured ways to think about token design, and academic papers on crypto economics go deeper into the theory. Comparing real projects side by side ties it together: put two tokens’ supply, allocation, and utility next to each other and see which choices hold up.
What events can change a token’s supply and demand quickly?
Token unlocks, emission changes, and major DAO votes are event risks that can shift supply and demand fast. Put the dates on your calendar for any token you hold, and read governance proposals before they pass rather than after.
Tokenomics as a quality filter, not a price forecast
Tokenomics separates durable demand from momentum-driven price moves, though it can’t predict short-term swings. A token’s economic rules sit on a public chain you can inspect, instead of resting on a slide deck.
When you look at any token, three questions cover most of what matters. How many tokens will exist, and when? Who owns them today? What creates ongoing demand? If the docs and on-chain data answer all three clearly, the design is worth studying further. If they don’t, you’ve already learned what you needed to know.